User Manual
Page 6
... 12: Statistics Getting Started: Building Height and City Size .......... 12-2 Setting Up a Statistical Analysis 12-9 Viewing List Elements 12-10 Editing List Elements 12-11 STAT EDIT Menu 12-12 Statistical Analysis 12-13 Statistical Variables 12-14 Types of Statistical Analysis 12-15 Statistical Analysis in a Program 12-17 Statistical...
... 12: Statistics Getting Started: Building Height and City Size .......... 12-2 Setting Up a Statistical Analysis 12-9 Viewing List Elements 12-10 Editing List Elements 12-11 STAT EDIT Menu 12-12 Statistical Analysis 12-13 Statistical Variables 12-14 Types of Statistical Analysis 12-15 Statistical Analysis in a Program 12-17 Statistical...
User Manual
Page 36
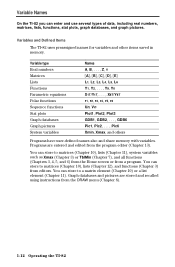
... . , Pic6 Xmin, Xmax, and others Programs have user-defined names also and share memory with variables. Variables and Defined Items The TI.82 uses preassigned names for variables and other items saved in memory. You can store to matrices (Chapter 10), lists (Chapter 11), system variables...Chapter 3) from the DRAW menu (Chapter 8). 1-12 Operating the TI.82 You can enter and use several types of data, including real numbers, matrices, lists, functions, stat plots, graph databases, and graph pictures. Graph databases and pictures are entered and edited from a program. Programs ...
... . , Pic6 Xmin, Xmax, and others Programs have user-defined names also and share memory with variables. Variables and Defined Items The TI.82 uses preassigned names for variables and other items saved in memory. You can store to matrices (Chapter 10), lists (Chapter 11), system variables...Chapter 3) from the DRAW menu (Chapter 8). 1-12 Operating the TI.82 You can enter and use several types of data, including real numbers, matrices, lists, functions, stat plots, graph databases, and graph pictures. Graph databases and pictures are entered and edited from a program. Programs ...

User Manual
Page 65
... (Chapter 8). Enter or edit a function in this chapter. Deselect stat plots, if appropriate (Chapter 12.) Exploring a Graph Once you have defined a graph, you set the modes, enter and select the functions to graph, and define the viewing WINDOW and WINDOW FORMAT. Later, you can recall that ... Later, you want to Func graphing. 2. You can store a picture of the current graph display in Defining a Graph There are six basic steps to explore the behavior of the TI.82 to defining a graph. You may not need to recreate the current graph. Saving a Graph You can store the elements that ...
... (Chapter 8). Enter or edit a function in this chapter. Deselect stat plots, if appropriate (Chapter 12.) Exploring a Graph Once you have defined a graph, you set the modes, enter and select the functions to graph, and define the viewing WINDOW and WINDOW FORMAT. Later, you can recall that ... Later, you want to Func graphing. 2. You can store a picture of the current graph display in Defining a Graph There are six basic steps to explore the behavior of the TI.82 to defining a graph. You may not need to recreate the current graph. Saving a Graph You can store the elements that ...
User Manual
Page 73
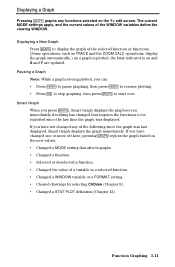
...functions selected on the Y= edit screen. Displaying a Graph Pressing s graphs any of the following since the last time the graph was last displayed, Smart Graph displays the graph immediately. Function Graphing 3-11 The current MODE settings apply, and the ...Graph When you have not changed that affects graphs. ¦ Changed a function. ¦ Selected or deselected a function. ¦ Changed the value of a variable in a selected function. ¦ Changed a WINDOW variable or a FORMAT setting. ¦ Cleared drawings by selecting ClrDraw (Chapter 8). ¦ Changed a STAT...
...functions selected on the Y= edit screen. Displaying a Graph Pressing s graphs any of the following since the last time the graph was last displayed, Smart Graph displays the graph immediately. Function Graphing 3-11 The current MODE settings apply, and the ...Graph When you have not changed that affects graphs. ¦ Changed a function. ¦ Selected or deselected a function. ¦ Changed the value of a variable in a selected function. ¦ Changed a WINDOW variable or a FORMAT setting. ¦ Cleared drawings by selecting ClrDraw (Chapter 8). ¦ Changed a STAT...

User Manual
Page 113
DRAW DRAW Menu To display the DRAW DRAW menu, press y
DRAW DRAW Menu To display the DRAW DRAW menu, press y

User Manual
Page 125
... stored database. 1. RecallGDB GDBn 3. The new graph database replaces the current one. The graph can store up to six graph databases and recall any Stat Plot definitions. Graph Databases The elements of elements that define a particular graph. You can be recreated from memory through the MEM... 3 (to select StoreGDB). Select GDB1, GDB2, GDB3, GDB4, GDB5, or GDB6. The new graph is not plotted. (The TI.82 changes graphing MODE automatically, if necessary.) Deleting a Graph Database Graph databases are replaced. Press y ãDRAWä | (to display the DRAW STO menu) 3 (to...
... stored database. 1. RecallGDB GDBn 3. The new graph database replaces the current one. The graph can store up to six graph databases and recall any Stat Plot definitions. Graph Databases The elements of elements that define a particular graph. You can be recreated from memory through the MEM... 3 (to select StoreGDB). Select GDB1, GDB2, GDB3, GDB4, GDB5, or GDB6. The new graph is not plotted. (The TI.82 changes graphing MODE automatically, if necessary.) Deleting a Graph Database Graph databases are replaced. Press y ãDRAWä | (to display the DRAW STO menu) 3 (to...

User Manual
Page 127
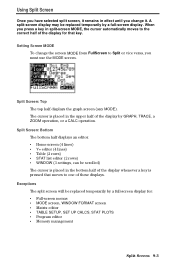
Chapter 9: Split Screen On the TI.82, you can simultaneously display a graph (including a stat plot) and an editor such as the Home screen, Y= editor, list editor, or table editor. Chapter Contents Getting Started: Polynomial Coefficients 9-2 Using Split Screen 9-3 Split Screen 9-1
Chapter 9: Split Screen On the TI.82, you can simultaneously display a graph (including a stat plot) and an editor such as the Home screen, Y= editor, list editor, or table editor. Chapter Contents Getting Started: Polynomial Coefficients 9-2 Using Split Screen 9-3 Split Screen 9-1
User Manual
Page 129
... screen will be replaced temporarily by a full-screen display. Setting Screen MODE To change it remains in the upper half of the display by GRAPH, TRACE, a ZOOM operation, or a CALC operation. When you must use the MODE screen. The cursor is pressed that key. Using Split... one of the display for : ¦ Full-screen menus ¦ MODE screen, WINDOW FORMAT screen ¦ Matrix editor ¦ TABLE SETUP, SET UP CALCS, STAT PLOTS ¦ Program editor ¦ Memory management Split Screen 9-3 Split Screen: Bottom The bottom half displays an editor. ¦ Home screen (4 lines) ¦...
... screen will be replaced temporarily by a full-screen display. Setting Screen MODE To change it remains in the upper half of the display by GRAPH, TRACE, a ZOOM operation, or a CALC operation. When you must use the MODE screen. The cursor is pressed that key. Using Split... one of the display for : ¦ Full-screen menus ¦ MODE screen, WINDOW FORMAT screen ¦ Matrix editor ¦ TABLE SETUP, SET UP CALCS, STAT PLOTS ¦ Program editor ¦ Memory management Split Screen 9-3 Split Screen: Bottom The bottom half displays an editor. ¦ Home screen (4 lines) ¦...
User Manual
Page 147
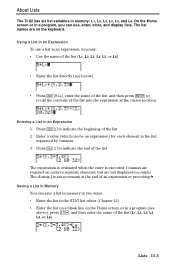
... memory: L1, L2, L3, L4, L5, and L6. Enter a value (which can save a list in memory in two ways: ¦ Enter the list in the STAT list editor (Chapter 12). ¦ Enter the list on a blank line on the keyboard. Press y ã}ä to recall the contents of the list into... the expression at the end of the list (L1, L2, L3, L4, L5, or L6). The list names are required on output. About Lists The TI.82 has six list variables in the list, separated by commas. 3.
... memory: L1, L2, L3, L4, L5, and L6. Enter a value (which can save a list in memory in two ways: ¦ Enter the list in the STAT list editor (Chapter 12). ¦ Enter the list on a blank line on the keyboard. Press y ã}ä to recall the contents of the list into... the expression at the end of the list (L1, L2, L3, L4, L5, or L6). The list names are required on output. About Lists The TI.82 has six list variables in the list, separated by commas. 3.

User Manual
Page 150
Accesses the list dimension. Note: dim and Fill( are the same as SortA( and SortD( on the STAT EDIT menu. SortA(, SortD( SortA( (sort ascending) and SortD( (sort descending) have two uses. ¦ With one listname, they sort the elements of an existing ...
Accesses the list dimension. Note: dim and Fill( are the same as SortA( and SortD( on the STAT EDIT menu. SortA(, SortD( SortA( (sort ascending) and SortD( (sort descending) have two uses. ¦ With one listname, they sort the elements of an existing ...

User Manual
Page 155
...12-9 Viewing List Elements 12-10 Editing List Elements 12-11 STAT EDIT Menu 12-12 Statistical Analysis 12-13 Statistical Variables 12-14 Types of data, calculating statistical results, fitting data to a model, and plotting data.... These include entering lists of Statistical Analysis 12-15 Statistical Analysis in a Program 12-17 Statistical Plotting 12-18 Statistical Plotting in a Program 12-22 Statistics 12-1 Chapter 12: Statistics This chapter describes the tools for analyzing statistical data on the TI.82...
...12-9 Viewing List Elements 12-10 Editing List Elements 12-11 STAT EDIT Menu 12-12 Statistical Analysis 12-13 Statistical Variables 12-14 Types of data, calculating statistical results, fitting data to a model, and plotting data.... These include entering lists of Statistical Analysis 12-15 Statistical Analysis in a Program 12-17 Statistical Plotting 12-18 Statistical Plotting in a Program 12-22 Statistics 12-1 Chapter 12: Statistics This chapter describes the tools for analyzing statistical data on the TI.82...

User Manual
Page 156
..., then predict how many buildings of L1. 12-2 Statistics To clear any existing lists, press ... 4 (to copy ClrList to find in the same list. The STAT list editor is a fast-paced introduction. Press 500000 Í 800000 Í 250000 Í 500000 Í 750000 Í 950000 Í to display the... menu. 3. to enter the remaining elements of more than 12 stories you type, the value is shown in the STAT list editor and sorting it. Press 1 (to the second element in a city of L1 and the cursor moves to select Edit...). As you would expect ...
..., then predict how many buildings of L1. 12-2 Statistics To clear any existing lists, press ... 4 (to copy ClrList to find in the same list. The STAT list editor is a fast-paced introduction. Press 500000 Í 800000 Í 250000 Í 500000 Í 750000 Í 950000 Í to display the... menu. 3. to enter the remaining elements of more than 12 stories you type, the value is shown in the STAT list editor and sorting it. Press 1 (to the second element in a city of L1 and the cursor moves to select Edit...). As you would expect ...

User Manual
Page 157
Press ~ to move to enter the elements of list L2. 6. The lists have been updated in memory. Press ... 2 (to select SortA(, which is copied to the Home screen) y ãL1ä (to select the independent list) ¢ y ãL2ä (to display the lists. Statistics 12-3 5. Press 4 Í 31 Í 42 Í 9 Í 20 Í 55 Í 73 Í to the first element of L2. 7. You can sort the data by size of city. Press ... 1 to use the STAT list editor to select the dependent list) ¤ Í. 8.
Press ~ to move to enter the elements of list L2. 6. The lists have been updated in memory. Press ... 2 (to select SortA(, which is copied to the Home screen) y ãL1ä (to select the independent list) ¢ y ãL2ä (to display the lists. Statistics 12-3 5. Press 4 Í 31 Í 42 Í 9 Í 20 Í 55 Í 73 Í to the first element of L2. 7. You can sort the data by size of city. Press ... 1 to use the STAT list editor to select the dependent list) ¤ Í. 8.
User Manual
Page 158
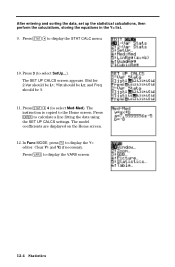
...; to select SetUp...). and Freq should be L1; Press Í to the Home screen. Clear Y1 and Y2 if necessary. The instruction is copied to calculate a line fitting the data using the SET UP CALCS settings. Press ... ~ 4 (to display the Y= editor. The SET UP CALCS screen appears. The model coefficients are... displayed on the Home screen. 12. In Func MODE, press o to select Med.Med). Press ... ~ to display the STAT CALC menu. 10. Xlist for 2-Var should be L2; Ylist should be 1. 11.
...; to select SetUp...). and Freq should be L1; Press Í to the Home screen. Clear Y1 and Y2 if necessary. The instruction is copied to calculate a line fitting the data using the SET UP CALCS settings. Press ... ~ 4 (to display the Y= editor. The SET UP CALCS screen appears. The model coefficients are... displayed on the Home screen. 12. In Func MODE, press o to select Med.Med). Press ... ~ to display the STAT CALC menu. 10. Xlist for 2-Var should be L2; Ylist should be 1. 11.

User Manual
Page 160
.... Press † to move to display the Plot1 screen). ZoomStat examines the data for all currently selected Stat Plots and adjusts the viewing WINDOW to include all points, which are shown on the current graph. (This also plots the regression equations in the upper right corner of the display. Press ~ to trace... and traced simultaneously. 17. Press 1 (to Y2. 12-6 Statistics Press † again to move to turn Plot1 On. To plot statistical data, you have done calculations to fit the data to one or more models and stored the resulting equations in lists and then define the plot.
.... Press † to move to display the Plot1 screen). ZoomStat examines the data for all currently selected Stat Plots and adjusts the viewing WINDOW to include all points, which are shown on the current graph. (This also plots the regression equations in the upper right corner of the display. Press ~ to trace... and traced simultaneously. 17. Press 1 (to Y2. 12-6 Statistics Press † again to move to turn Plot1 On. To plot statistical data, you have done calculations to fit the data to one or more models and stored the resulting equations in lists and then define the plot.

User Manual
Page 161
...L4) y ãL2ä (the observed) ¹ y ãL3ä (the predicted) Í. 24. Press y ãY-VARSä 1 (to select Function...) 1 (to display the STAT list editor. Press ... 1 to select Y1) £ y ãL1ä ¤. This defines L5 as the values predicted by the LinReg(ax+b) line. 25. Press...Press Í to select Y2) £ y ãL1ä ¤ Í. Press y ãY-VARSä 1 (to select Function...) 2 (to store the values in the STAT list editor. This defines L3 as the values predicted by the Med.Med line. 22. Press ~ } to move onto L5.
...L4) y ãL2ä (the observed) ¹ y ãL3ä (the predicted) Í. 24. Press y ãY-VARSä 1 (to select Function...) 1 (to display the STAT list editor. Press ... 1 to select Y1) £ y ãL1ä ¤. This defines L5 as the values predicted by the LinReg(ax+b) line. 25. Press...Press Í to select Y2) £ y ãL1ä ¤ Í. Press y ãY-VARSä 1 (to select Function...) 2 (to store the values in the STAT list editor. This defines L3 as the values predicted by the Med.Med line. 22. Press ~ } to move onto L5.

User Manual
Page 162
...162; 0 ¤ Í. The value of Y1 (Med.Med model) for X=300,000 is shown. Press y ãSTAT PLOTä. Press † † Í to define Ylist as L6. Press ~ 1 (to select round()...Xlist as +. Press to 0 decimal places (whole buildings), is shown. 12-8 Statistics Press y ãSTAT PLOTä. Press 2 to plot the residuals. › marks the residuals from Med.Med and + ...off . Press y ãENTRYä } ~ y ãY-VARSä 1 2 Í. Press y ãSTAT PLOTä to select Plot3. Press † † Í to turn the plot off Y1 and Y2. Press...
...162; 0 ¤ Í. The value of Y1 (Med.Med model) for X=300,000 is shown. Press y ãSTAT PLOTä. Press † † Í to define Ylist as L6. Press ~ 1 (to select round()...Xlist as +. Press to 0 decimal places (whole buildings), is shown. 12-8 Statistics Press y ãSTAT PLOTä. Press 2 to plot the residuals. › marks the residuals from Med.Med and + ...off . Press y ãENTRYä } ~ y ãY-VARSä 1 2 Í. Press y ãSTAT PLOTä to select Plot3. Press † † Í to turn the plot off Y1 and Y2. Press...

User Manual
Page 163
... Plot the data (page 12.18 through 12.17). 4. Deleting a List You can use in list(s) (pages 12.9 through 12.12). 2. Enter the stat data in stat calculations. from the STAT EDIT menu. Statistics 12-9 and then press 1 or Í to a model (page 12.14 through 12.21). The top line displays the names...screen. Several types of the elements in lists. The full value of the lists (even if the list is shown on the bottom line. The TI.82 has six list variables in memory that you can delete the contents of a list in several ways: ¦ Use the ClrList instruction (page 12...
... Plot the data (page 12.18 through 12.17). 4. Deleting a List You can use in list(s) (pages 12.9 through 12.12). 2. Enter the stat data in stat calculations. from the STAT EDIT menu. Statistics 12-9 and then press 1 or Í to a model (page 12.14 through 12.21). The top line displays the names...screen. Several types of the elements in lists. The full value of the lists (even if the list is shown on the bottom line. The TI.82 has six list variables in memory that you can delete the contents of a list in several ways: ¦ Use the ClrList instruction (page 12...

User Manual
Page 164
... character y [INS] { Moves the rectangular cursor within the current column. Deletes the current list element (closes up list). 12-10 Statistics Viewing List Elements The STAT list editor has two "contexts," viewing and editing. Switches to the next. Viewing Context Keys In viewing context, you can move quickly from one list...
... character y [INS] { Moves the rectangular cursor within the current column. Deletes the current list element (closes up list). 12-10 Statistics Viewing List Elements The STAT list editor has two "contexts," viewing and editing. Switches to the next. Viewing Context Keys In viewing context, you can move quickly from one list...

User Manual
Page 166
... listnames, they sort the first list and then sort the remaining lists as SortA( and SortD( on the LIST OPS menu. accesses the STAT list editor and several instructions for use with lists. Sorts list in ascending order. Sorts list in descending order. SortA(, SortD( SortA( ...(sort ascending) and SortD( (sort descending) have two uses. ¦ With one or more listnames. All lists must be the same length. STAT EDIT Menu Pressing ... Deletes all elements of an existing list and update the list in memory. SortA(listname) SortA(listnameI,listnameD,listnameD, . . .) ClrList ...
... listnames, they sort the first list and then sort the remaining lists as SortA( and SortD( on the LIST OPS menu. accesses the STAT list editor and several instructions for use with lists. Sorts list in ascending order. Sorts list in descending order. SortA(, SortD( SortA( ...(sort ascending) and SortD( (sort descending) have two uses. ¦ With one or more listnames. All lists must be the same length. STAT EDIT Menu Pressing ... Deletes all elements of an existing list and update the list in memory. SortA(listname) SortA(listnameI,listnameD,listnameD, . . .) ClrList ...


