User Manual
Page 6
...Sequences 11-2 About Lists 11-3 LIST OPS Operations 11-6 LIST MATH Operations 11-9 Chapter 12: Statistics Getting Started: Building Height and City Size .......... 12-2 Setting Up a Statistical Analysis 12-9 Viewing List Elements 12-10 Editing List Elements 12-11 STAT EDIT Menu 12-12... Statistical Analysis 12-13 Statistical Variables 12-14 Types of Statistical Analysis 12-15 Statistical Analysis in a Program 12-17 Statistical Plotting 12-18 Statistical Plotting in a Program 12-22 Chapter 13: Programming Getting Started: ...
...Sequences 11-2 About Lists 11-3 LIST OPS Operations 11-6 LIST MATH Operations 11-9 Chapter 12: Statistics Getting Started: Building Height and City Size .......... 12-2 Setting Up a Statistical Analysis 12-9 Viewing List Elements 12-10 Editing List Elements 12-11 STAT EDIT Menu 12-12... Statistical Analysis 12-13 Statistical Variables 12-14 Types of Statistical Analysis 12-15 Statistical Analysis in a Program 12-17 Statistical Plotting 12-18 Statistical Plotting in a Program 12-22 Chapter 13: Programming Getting Started: ...

User Manual
Page 10
... curves, evaluating a function at multiple values, and entering statistical data. The TI.82 display is a saved image of the elements that are used in graphing and TABLE. Glossary This glossary provides definitions for activities such as a unit in a graph database to recreate the graph later. Expression Function Graph Database Graph Picture Home Screen Instruction List Matrix Menu Items...
... curves, evaluating a function at multiple values, and entering statistical data. The TI.82 display is a saved image of the elements that are used in graphing and TABLE. Glossary This glossary provides definitions for activities such as a unit in a graph database to recreate the graph later. Expression Function Graph Database Graph Picture Home Screen Instruction List Matrix Menu Items...
User Manual
Page 24
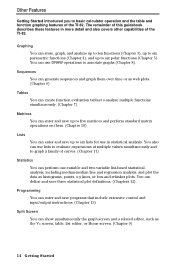
... Started introduced you to basic calculator operation and the table and function graphing features of the TI.82. The remainder of this guidebook describes these features in statistical analysis. Programming You can enter and save up to six lists for use in more detail and also covers other capabilities of the TI.82. Sequences You can generate...
... Started introduced you to basic calculator operation and the table and function graphing features of the TI.82. The remainder of this guidebook describes these features in statistical analysis. Programming You can enter and save up to six lists for use in more detail and also covers other capabilities of the TI.82. Sequences You can generate...
User Manual
Page 43
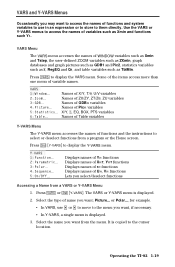
... than one menu of Picn variables 5: Statistics... Select the type of name you want from the menu. or Polar..., for example. ¦ In VARS, use in an expression or to store to select or deselect functions from a VARS or Y-VARS Menu 1. Operating the TI.82 1-19 Names of variable names. Names... It is copied to access the names of WINDOW variables such as Xmin and Tstep, the user-defined ZOOM variables such as ZXmin, graph databases and graph pictures such as GDB1 and Pic2, statistics variables such as v, RegEQ and Q1, and table variables such as Xmin and functions such Y1.
... than one menu of Picn variables 5: Statistics... Select the type of name you want from the menu. or Polar..., for example. ¦ In VARS, use in an expression or to store to select or deselect functions from a VARS or Y-VARS Menu 1. Operating the TI.82 1-19 Names of variable names. Names... It is copied to access the names of WINDOW variables such as Xmin and Tstep, the user-defined ZOOM variables such as ZXmin, graph databases and graph pictures such as GDB1 and Pic2, statistics variables such as v, RegEQ and Q1, and table variables such as Xmin and functions such Y1.
User Manual
Page 80
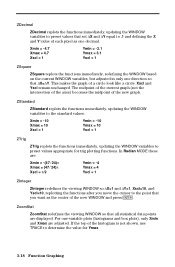
...determine the value for trig plotting functions. ZoomStat ZoomStat redefines the viewing WINDOW so that @X=@Y. The midpoint of the current graph (not the intersection of the axes) becomes the midpoint of a circle look like a circle. Xscl and Yscl ... X and Y value of each pixel as the center of the new WINDOW and press Í. This makes the graph of the new graph. For one-variable plots (histograms and box plots), only Xmin and Xmax are displayed. In Radian MODE these are:... cursor to the point that you want as one direction so that all statistical data points are adjusted.
...determine the value for trig plotting functions. ZoomStat ZoomStat redefines the viewing WINDOW so that @X=@Y. The midpoint of the current graph (not the intersection of the axes) becomes the midpoint of a circle look like a circle. Xscl and Yscl ... X and Y value of each pixel as the center of the new WINDOW and press Í. This makes the graph of the new graph. For one-variable plots (histograms and box plots), only Xmin and Xmax are displayed. In Radian MODE these are:... cursor to the point that you want as one direction so that all statistical data points are adjusted.

User Manual
Page 155
... 12-13 Statistical Variables 12-14 Types of data, calculating statistical results, fitting data to a model, and plotting data. These include entering lists of Statistical Analysis 12-15 Statistical Analysis in a Program 12-17 Statistical Plotting 12-18 Statistical Plotting in a Program 12-22 Statistics 12-1 Chapter 12: Statistics This chapter describes the tools for analyzing statistical data on the TI.82.
... 12-13 Statistical Variables 12-14 Types of data, calculating statistical results, fitting data to a model, and plotting data. These include entering lists of Statistical Analysis 12-15 Statistical Analysis in a Program 12-17 Statistical Plotting 12-18 Statistical Plotting in a Program 12-22 Statistics 12-1 Chapter 12: Statistics This chapter describes the tools for analyzing statistical data on the TI.82.

User Manual
Page 156
... Getting Started is displayed on the bottom line. 4. Read the chapter for details. Begin by entering the data in the first element of L1. 12-2 Statistics Population 150,000 500,000 800,000 250,000 500,000 750,000 950,000 Buildings>12 stories 4 31 42 9 20 55 73 1. to enter...
... Getting Started is displayed on the bottom line. 4. Read the chapter for details. Begin by entering the data in the first element of L1. 12-2 Statistics Population 150,000 500,000 800,000 250,000 500,000 750,000 950,000 Buildings>12 stories 4 31 42 9 20 55 73 1. to enter...

User Manual
Page 157
Press ... 1 to use the STAT list editor to select the dependent list) ¤ Í. 8. Press ... 2 (to select SortA(, which is copied to the Home screen) y ãL1ä (to select the independent list) ¢ y ãL2ä (to display the lists. The lists have been updated in memory. Statistics 12-3 5. Press 4 Í 31 Í 42 Í 9 Í 20 Í 55 Í 73 Í to the first element of list L2. 6. You can sort the data by size of L2. 7. Press ~ to move to enter the elements of city.
Press ... 1 to use the STAT list editor to select the dependent list) ¤ Í. 8. Press ... 2 (to select SortA(, which is copied to the Home screen) y ãL1ä (to select the independent list) ¢ y ãL2ä (to display the lists. The lists have been updated in memory. Statistics 12-3 5. Press 4 Í 31 Í 42 Í 9 Í 20 Í 55 Í 73 Í to the first element of list L2. 6. You can sort the data by size of L2. 7. Press ~ to move to enter the elements of city.
User Manual
Page 158
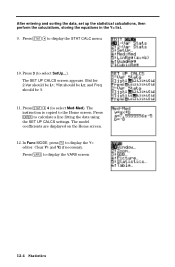
...coefficients are displayed on the Home screen. 12. In Func MODE, press o to display the STAT CALC menu. 10. Press to calculate a line fitting the data using the SET UP CALCS settings. The SET UP CALCS screen appears. Xlist for 2-Var should be 1. 11.... Press Í to display the VARS screen. 12-4 Statistics Press 3 (to select Med.Med). Press ... ~ 4 (to select SetUp...). After entering and sorting the data, set up the statistical calculations, then perform the calculations, storing the equations in the Y= list. 9. The instruction is copied to the...
...coefficients are displayed on the Home screen. 12. In Func MODE, press o to display the STAT CALC menu. 10. Press to calculate a line fitting the data using the SET UP CALCS settings. The SET UP CALCS screen appears. Xlist for 2-Var should be 1. 11.... Press Í to display the VARS screen. 12-4 Statistics Press 3 (to select Med.Med). Press ... ~ 4 (to select SetUp...). After entering and sorting the data, set up the statistical calculations, then perform the calculations, storing the equations in the Y= list. 9. The instruction is copied to the...

User Manual
Page 159
The regression equation for the current model equation (which was calculated using LinReg(ax+b)) is copied to Y2. 13. Press 5 (to select Statistics...) and ~ ~ to calculate the least-squares linear regression. 16. The current model equation (calculated using Med.Med) is copied to Y1. 15. Press Í to display the VARS EQ menu. 14. Press...
The regression equation for the current model equation (which was calculated using LinReg(ax+b)) is copied to Y2. 13. Press 5 (to select Statistics...) and ~ ~ to calculate the least-squares linear regression. 16. The current model equation (calculated using Med.Med) is copied to Y1. 15. Press Í to display the VARS EQ menu. 14. Press...

User Manual
Page 160
... WINDOW to display the Plot1 screen). ZoomStat examines the data for all points, which are shown on the current graph. (This also plots the regression equations in Y1 and Y2.) 20. Press q 9 (to trace the points...; again to move to turn Plot1 On. Press y ãSTAT PLOTä to Y2. 12-6 Statistics Leave Type as a scatter plot, Xlist as L1, and Ylist as L2 and Mark as indicated by ...P1 in the upper right corner of the display. To plot statistical data, you have done calculations to fit the data to one or more models and stored the resulting equations in ...
... WINDOW to display the Plot1 screen). ZoomStat examines the data for all points, which are shown on the current graph. (This also plots the regression equations in Y1 and Y2.) 20. Press q 9 (to trace the points...; again to move to turn Plot1 On. Press y ãSTAT PLOTä to Y2. 12-6 Statistics Leave Type as a scatter plot, Xlist as L1, and Ylist as L2 and Mark as indicated by ...P1 in the upper right corner of the display. To plot statistical data, you have done calculations to fit the data to one or more models and stored the resulting equations in ...

User Manual
Page 161
... for both models. Press ~ ~ } to move the cursor onto the name L4) y ãL2ä (the observed) ¹ y ãL3ä (the predicted) Í. 24. Statistics 12-7 Press y ãY-VARSä 1 (to select Function...) 2 (to select Y1) £ y ãL1ä ¤. You can define predicted values and residuals. 21. Press...
... for both models. Press ~ ~ } to move the cursor onto the name L4) y ãL2ä (the observed) ¹ y ãL3ä (the predicted) Í. 24. Statistics 12-7 Press y ãY-VARSä 1 (to select Function...) 2 (to select Y1) £ y ãL1ä ¤. You can define predicted values and residuals. 21. Press...

User Manual
Page 162
You can use the TI.82 to select Plot3. Press to define Xlist as L1. The value of Y1 (Med.Med model) for X=300,000 is shown. Press y ãSTAT PLOT&#...;. Press 1 to select Plot2. Press † ~ Í to define Ylist as +. Press 2 to select Plot1. Press Í to 0 decimal places (whole buildings), is shown. 12-8 Statistics Press y ãSTAT PLOTä to select Y1) £ 300000 ¤ ¢ 0 ¤ Í. Press ~ 1 (to select round() y ãY-VARSä 1 (to select Function...
You can use the TI.82 to select Plot3. Press to define Xlist as L1. The value of Y1 (Med.Med model) for X=300,000 is shown. Press y ãSTAT PLOT&#...;. Press 1 to select Plot2. Press † ~ Í to define Ylist as +. Press 2 to select Plot1. Press Í to 0 decimal places (whole buildings), is shown. 12-8 Statistics Press y ãSTAT PLOTä to select Y1) £ 300000 ¤ ¢ 0 ¤ Í. Press ~ 1 (to select round() y ãY-VARSä 1 (to select Function...

User Manual
Page 163
...STAT list editor displays up statistical calculations (page 12.13). 3. The center portion of the elements in abbreviated form if necessary. Deleting a List You can use in list(s) (pages 12.9 through 12.17). 4. Setting Up a Statistical Analysis The data for statistical analyses is empty). The...... Enter the stat data in stat calculations. from the STAT EDIT menu. Statistics 12-9 Calculate the statistical variables or fit the data to a model (page 12.14 through 12.12). 2. The full value of statistical analyses are available. The TI.82 has six list variables in memory that ...
...STAT list editor displays up statistical calculations (page 12.13). 3. The center portion of the elements in abbreviated form if necessary. Deleting a List You can use in list(s) (pages 12.9 through 12.17). 4. Setting Up a Statistical Analysis The data for statistical analyses is empty). The...... Enter the stat data in stat calculations. from the STAT EDIT menu. Statistics 12-9 Calculate the statistical variables or fit the data to a model (page 12.14 through 12.12). 2. The full value of statistical analyses are available. The TI.82 has six list variables in memory that ...

User Manual
Page 164
... cursor within the current column. Inserts a list element (value is displayed on the bottom line; Deletes the current list element (closes up list). 12-10 Statistics Viewing List Elements The STAT list editor has two "contexts," viewing and editing. Moves the rectangular cursor within the current row. Viewing Context Keys In...
... cursor within the current column. Inserts a list element (value is displayed on the bottom line; Deletes the current list element (closes up list). 12-10 Statistics Viewing List Elements The STAT list editor has two "contexts," viewing and editing. Moves the rectangular cursor within the current row. Viewing Context Keys In...

User Manual
Page 165
... typing over digits. ¦ Press ' to the list element; switches to change the value of the edit cursor on the bottom line. Editing a List Element 1. Statistics 12-11 If it is the first character typed, the value on the bottom line is active on the bottom line. Activates insert cursor. Move...
... typing over digits. ¦ Press ' to the list element; switches to change the value of the edit cursor on the bottom line. Editing a List Element 1. Statistics 12-11 If it is the first character typed, the value on the bottom line is active on the bottom line. Activates insert cursor. Move...

User Manual
Page 166
... elements of one listname, they sort the elements of list. Sorts list in ascending order. Sorts list in descending order. ClrList listnameA,listnameB, . . . 12-12 Statistics STAT EDIT Menu EDIT CALC 1: Edit... 2: SortA( 3: SortD( 4: ClrList Displays list editor (page 12.9). STAT EDIT Menu Pressing ... All lists must be the same length...
... elements of one listname, they sort the elements of list. Sorts list in ascending order. Sorts list in descending order. ClrList listnameA,listnameB, . . . 12-12 Statistics STAT EDIT Menu EDIT CALC 1: Edit... 2: SortA( 3: SortD( 4: ClrList Displays list editor (page 12.9). STAT EDIT Menu Pressing ... All lists must be the same length...
User Manual
Page 167
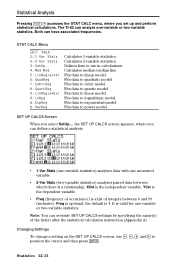
... variable. ¦ 2-Var Stats (two-variable statistics) analyzes paired data between 0 and 99 (inclusive). The TI.82 can analyze one -variable or two-variable statistics. Both can override SET UP CALCS settings by specifying the name(s) of integers between which there is a list of the list(s) after the statistical calculation instruction (Appendix A). Fits data to exponential...
... variable. ¦ 2-Var Stats (two-variable statistics) analyzes paired data between 0 and 99 (inclusive). The TI.82 can analyze one -variable or two-variable statistics. Both can override SET UP CALCS settings by specifying the name(s) of integers between which there is a list of the list(s) after the statistical calculation instruction (Appendix A). Fits data to exponential...

User Manual
Page 168
Some are displayed when 1-Var Stats or 2-Var Stats are calculated as indicated below. Variables mean of x values sum of x values sum of x2 values sample standard deviation of x population standard deviation of x number of data ... EQ EQ EQ PTS Q1 and Q3 The quartile Q1 is the median of the ordinals to the right of Med. 12-14 Statistics Statistical Variables The statistical variables are calculated. If a list is edited or the type of analysis is the median of the ordinals to the left of x ... You can access these...
Some are displayed when 1-Var Stats or 2-Var Stats are calculated as indicated below. Variables mean of x values sum of x values sum of x2 values sample standard deviation of x population standard deviation of x number of data ... EQ EQ EQ PTS Q1 and Q3 The quartile Q1 is the median of the ordinals to the right of Med. 12-14 Statistics Statistical Variables The statistical variables are calculated. If a list is edited or the type of analysis is the median of the ordinals to the left of x ... You can access these...

User Manual
Page 169
... median-median line (resistant line) technique, calculating the summary points x1, y1, x2, y2, x3, and y3. You can override SET UP CALCS settings by specifying the name(s) of Statistical Analysis The SET UP CALCS settings are required... the list(s) and frequency after the statistical calculation instruction (Appendix A). 1-Var Stats 1-Var Stats (one-variable statistics, STAT CALC item 1) calculates statistical variables as indicated on the previous page. 2-Var Stats 2-Var Stats (two-variable statistics, STAT CALC item 2) calculates statistical variables as indicated on the previous page...
... median-median line (resistant line) technique, calculating the summary points x1, y1, x2, y2, x3, and y3. You can override SET UP CALCS settings by specifying the name(s) of Statistical Analysis The SET UP CALCS settings are required... the list(s) and frequency after the statistical calculation instruction (Appendix A). 1-Var Stats 1-Var Stats (one-variable statistics, STAT CALC item 1) calculates statistical variables as indicated on the previous page. 2-Var Stats 2-Var Stats (two-variable statistics, STAT CALC item 2) calculates statistical variables as indicated on the previous page...


