User Manual
Page 33
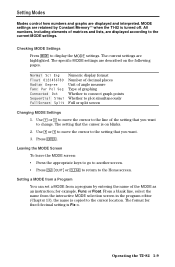
... specific MODE settings are described on blinks. 2. Normal Sci Eng Float 0123456789 Radian Degree Func Par Pol Seq Connected Dot Sequential Simul FullScreen Split Numeric display format Number of decimal places Unit of angle measure Type of matrices and lists, are retained by entering ... a blank line, select the name from a program by Constant Memoryé when the TI.82 is Fix n. MODE settings are displayed according to the cursor location. Setting Modes Modes control how numbers and graphs are highlighted. The format for example, Func or Float. Checking MODE Settings Press z to...
... specific MODE settings are described on blinks. 2. Normal Sci Eng Float 0123456789 Radian Degree Func Par Pol Seq Connected Dot Sequential Simul FullScreen Split Numeric display format Number of decimal places Unit of angle measure Type of matrices and lists, are retained by entering ... a blank line, select the name from a program by Constant Memoryé when the TI.82 is Fix n. MODE settings are displayed according to the cursor location. Setting Modes Modes control how numbers and graphs are highlighted. The format for example, Func or Float. Checking MODE Settings Press z to...
User Manual
Page 35
... plots only the calculated points of X (Chapter 3). FullScreen, Split FullScreen uses the entire screen to display a graph or edit screen. Operating the TI.82 1-11 Answers display in radians. Func, Par, Pol, Seq Func (function) graphing plots functions where Y is a function of the selected functions. Seq (sequence) graphing plots sequences (Chapter 6). Sequential, Simul Sequential graphing evaluates and plots...
... plots only the calculated points of X (Chapter 3). FullScreen, Split FullScreen uses the entire screen to display a graph or edit screen. Operating the TI.82 1-11 Answers display in radians. Func, Par, Pol, Seq Func (function) graphing plots functions where Y is a function of the selected functions. Seq (sequence) graphing plots sequences (Chapter 6). Sequential, Simul Sequential graphing evaluates and plots...
User Manual
Page 66
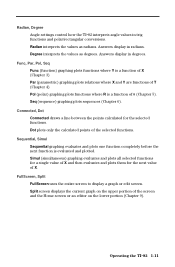
... are interpreted. Use †, }, ~, and | to place the cursor on the TI.82 are described in this chapter. Setting Graph Modes Pressing z displays the current MODE settings (Chapter 1). Setting Modes from a program. Sequential or Simul affects how functions are highlighted. The name of graphing on the MODE that you have more than one function selected...
... are interpreted. Use †, }, ~, and | to place the cursor on the TI.82 are described in this chapter. Setting Graph Modes Pressing z displays the current MODE settings (Chapter 1). Setting Modes from a program. Sequential or Simul affects how functions are highlighted. The name of graphing on the MODE that you have more than one function selected...

User Manual
Page 74
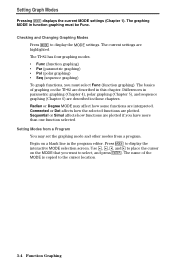
Graphing a Family of Curves If you enter a list (Chapter 11) as an element in an expression, the TI.82 plots the function for each value in the list, graphing a family of curves. (In Simul, it graphs all functions for the first element, and so on.) {2,4,6}sin X graphs three functions: 2 sin X, 4 sin X, and 6 sin X. {2,4,6}sin {1,2,3}X graphs 2 sin X, 4 sin 2X, and 6 sin 3X. 3-12 Function Graphing
Graphing a Family of Curves If you enter a list (Chapter 11) as an element in an expression, the TI.82 plots the function for each value in the list, graphing a family of curves. (In Simul, it graphs all functions for the first element, and so on.) {2,4,6}sin X graphs three functions: 2 sin X, 4 sin X, and 6 sin X. {2,4,6}sin {1,2,3}X graphs 2 sin X, 4 sin 2X, and 6 sin 3X. 3-12 Function Graphing
User Manual
Page 101
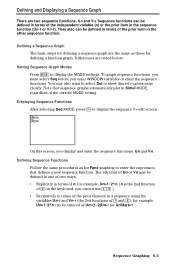
... sequence functions, Un and Vn. Displaying Sequence Functions After selecting Seq MODE, press o to enter the expression that sequence graphs automatically plot in Simul MODE, regardless of ¬ and −); for defining a function graph. On this screen, you enter WINDOW variables or enter the sequence functions. Sequence functions can be defined in a sequence...
... sequence functions, Un and Vn. Displaying Sequence Functions After selecting Seq MODE, press o to enter the expression that sequence graphs automatically plot in Simul MODE, regardless of ¬ and −); for defining a function graph. On this screen, you enter WINDOW variables or enter the sequence functions. Sequence functions can be defined in a sequence...
User Manual
Page 200
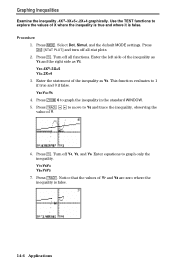
Graphing Inequalities Examine the inequality .4X3-3X+5
Graphing Inequalities Examine the inequality .4X3-3X+5

User Manual
Page 205
..." from the unit circle. Note: The "unwrapping" can use the parametric graphing feature of the TI.82 to "unwrap" that can be plotted in function graphing can be generalized. Applications 14-11 Select Radian, Par, and Simul. 2. Enter the expressions to pause and resume graphing as F(T). X2T=T Y2T=sin T 5. Tmin = 0 Tmax = 2p Tstep = .1 Xmin = M2 Xmax...
..." from the unit circle. Note: The "unwrapping" can use the parametric graphing feature of the TI.82 to "unwrap" that can be plotted in function graphing can be generalized. Applications 14-11 Select Radian, Par, and Simul. 2. Enter the expressions to pause and resume graphing as F(T). X2T=T Y2T=sin T 5. Tmin = 0 Tmax = 2p Tstep = .1 Xmin = M2 Xmax...

User Manual
Page 206
... equation describes the location of the person on a ferris wheel and a ball thrown to that person. Select Par, Connected, and Simul. Press p. Enter the expressions to define the path of the ferris wheel and the path of the ball. The following parametric equation... = r + r sin a where a = 2p T à s and r = d à 2 The ball is happening with velocity (v0) of 22 meters per second at time T. Simultaneous MODE simulates what is thrown from the horizontal. Tmin = 0 Tmax = 12 Tstep = .1 Xmin = M13 Xmax = 34 Xscl = 10 Ymin = 0 Ymax = 31 Yscl = 10 4. X1T = 10cos (pTà...
... equation describes the location of the person on a ferris wheel and a ball thrown to that person. Select Par, Connected, and Simul. Press p. Enter the expressions to define the path of the ferris wheel and the path of the ball. The following parametric equation... = r + r sin a where a = 2p T à s and r = d à 2 The ball is happening with velocity (v0) of 22 meters per second at time T. Simultaneous MODE simulates what is thrown from the horizontal. Tmin = 0 Tmax = 12 Tstep = .1 Xmin = M13 Xmax = 34 Xscl = 10 Ymin = 0 Ymax = 31 Yscl = 10 4. X1T = 10cos (pTà...

User Manual
Page 208
... parametric equations xt = t ‡(2 g (2 - Press z. X1T=T‡(2...9.8(2-0.50)) Y1T=0.50-(9.8à2)T2 3. menu) 1 (to 0.75 meters. Select Par, Simul, and the defaults. 2. Change the height from 0.50 to select X1T) Í. Several holes of relatively small diameter will be used to animate a process, providing...the reservoir in meters, and g is 2 meters. Press Í to move to display the Parametric... Reservoir Problem On the TI.82, parametric graphing can be drilled in the side to make streams of water that the hole is no initial velocity in the y-direction.) Integrating ...
... parametric equations xt = t ‡(2 g (2 - Press z. X1T=T‡(2...9.8(2-0.50)) Y1T=0.50-(9.8à2)T2 3. menu) 1 (to 0.75 meters. Select Par, Simul, and the defaults. 2. Change the height from 0.50 to select X1T) Í. Several holes of relatively small diameter will be used to animate a process, providing...the reservoir in meters, and g is 2 meters. Press Í to move to display the Parametric... Reservoir Problem On the TI.82, parametric graphing can be drilled in the side to make streams of water that the hole is no initial velocity in the y-direction.) Integrating ...

User Manual
Page 212
...of 1àX. Enter the numerical integral of 1àT and the mathematical integral of Calculus The TI.82 can graph functions that 1 [ ‰ ] x Dx 1àt dt = 1àx 1 Procedure 1 1. The busy indicator displays while the graph is being plotted. Press o and turn off all functions. Xmin = .01 Xmax = ... Y1=fnInt(1àT,T,1,X) Y2=ln X 4. Press p. Set the viewing WINDOW. Turn off all stat plots. 2. Press z. Select Simul and the default MODE settings. Problem 1 Demonstrate graphically that ‰x F(x) = 1àt dt = ln(x), x>0 and that are...
...of 1àX. Enter the numerical integral of 1àT and the mathematical integral of Calculus The TI.82 can graph functions that 1 [ ‰ ] x Dx 1àt dt = 1àx 1 Procedure 1 1. The busy indicator displays while the graph is being plotted. Press o and turn off all functions. Xmin = .01 Xmax = ... Y1=fnInt(1àT,T,1,X) Y2=ln X 4. Press p. Set the viewing WINDOW. Turn off all stat plots. 2. Press z. Select Simul and the default MODE settings. Problem 1 Demonstrate graphically that ‰x F(x) = 1àt dt = ln(x), x>0 and that are...

User Manual
Page 244
Shade(lowerfunc, upperfunc) Shade area above lowerfunc and below upperfunc. (I) y ãDRAWä DRAW áShade(â 8.8 Shade(lowerfunc, upperfunc,resolution) Shade area above lowerfunc, below upperfunc with 1
Shade(lowerfunc, upperfunc) Shade area above lowerfunc and below upperfunc. (I) y ãDRAWä DRAW áShade(â 8.8 Shade(lowerfunc, upperfunc,resolution) Shade area above lowerfunc, below upperfunc with 1
User Manual
Page 249
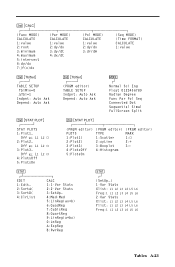
y ãCALCä (Func MODE) CALCULATE 1:value 2:root 3:minimum 4:maximum (Par MODE) CALCULATE 1:value 2:dy/dx 3:dy/dt 4:dx/dt (Pol MODE) CALCULATE 1:value 2:dy/dx 3:dr/dq (Seq MODE) (Time FORMAT) CALCULATE 1:value 5:intersect 6:dy/dx 7:‰f(x)dx y ã...TblSet TABLE SETUP TblMin=0 @Tbl=1 Indpnt: Auto Ask Depend: Auto Ask y ãTblSet (PRGM editor) TABLE SETUP Indpnt: Auto Ask Depend: Auto Ask z ÚÙ Normal Sci Eng Float 0123456789 Radian Degree Func Par Pol Seq Connected Dot Sequential Simul...
y ãCALCä (Func MODE) CALCULATE 1:value 2:root 3:minimum 4:maximum (Par MODE) CALCULATE 1:value 2:dy/dx 3:dy/dt 4:dx/dt (Pol MODE) CALCULATE 1:value 2:dy/dx 3:dr/dq (Seq MODE) (Time FORMAT) CALCULATE 1:value 5:intersect 6:dy/dx 7:‰f(x)dx y ã...TblSet TABLE SETUP TblMin=0 @Tbl=1 Indpnt: Auto Ask Depend: Auto Ask y ãTblSet (PRGM editor) TABLE SETUP Indpnt: Auto Ask Depend: Auto Ask z ÚÙ Normal Sci Eng Float 0123456789 Radian Degree Func Par Pol Seq Connected Dot Sequential Simul...

User Manual
Page 275
..., 12-14, A-28 G (VARS) menu, 1-19, 12-14 Gx, Gy, Gx2, Gy2, Gxy, 12-14, A-28 Simul, 1-9, 1-11, 3-4, 3-12, A-18 sin, sin-1, 2-3, A-18, B-5 Sine, 2-3, A-18, B-5 SINGULAR MAT error, B-8 SINGULARITY error, B-9 sinh, sinh-1, 2-11, A-18, B-5 Smart Graph, 3-11, 3-24, 4-5, 5-5, 6-5 solve(, 2-5, 2-8, 3-22, A-18, A-19, B-4, B-6 to B-9 Solving equations, 2-5, 2-8, 3-22, A-18, A-19, B-4,...12-20, 12-22 STAT TYPE menu, 12-22 Statistics, 1-19, 12-1 to 12-22 analysis, 12-2 to 12-9, 12-13 to 12-22 calculations, 12-2 to 12-9, 12-13 to 12-17 data, 12-9 to 12-11 plotting, 12-6 to 12-8, 12-18 to B-9 SortA(, 11-6, 12...
..., 12-14, A-28 G (VARS) menu, 1-19, 12-14 Gx, Gy, Gx2, Gy2, Gxy, 12-14, A-28 Simul, 1-9, 1-11, 3-4, 3-12, A-18 sin, sin-1, 2-3, A-18, B-5 Sine, 2-3, A-18, B-5 SINGULAR MAT error, B-8 SINGULARITY error, B-9 sinh, sinh-1, 2-11, A-18, B-5 Smart Graph, 3-11, 3-24, 4-5, 5-5, 6-5 solve(, 2-5, 2-8, 3-22, A-18, A-19, B-4, B-6 to B-9 Solving equations, 2-5, 2-8, 3-22, A-18, A-19, B-4,...12-20, 12-22 STAT TYPE menu, 12-22 Statistics, 1-19, 12-1 to 12-22 analysis, 12-2 to 12-9, 12-13 to 12-22 calculations, 12-2 to 12-9, 12-13 to 12-17 data, 12-9 to 12-11 plotting, 12-6 to 12-8, 12-18 to B-9 SortA(, 11-6, 12...