Teachers Guide
Page 82
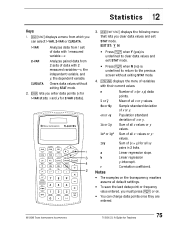
Statistics 12 Keys 1. % t displays a menu from which you can change data points once they are entered. © 1999 TEXAS INSTRUMENTS INCORPORATED TI-30X ÙS: A Guide for 2-VAR stats). 1 3 4 2 3. % w displays the following menu that lets you enter data points (x for all xy pairs in... sx or sy Gx or Gy Gx2 or Gy2 Gxy a b r Number of (x Q y) for 1-VAR stats; Sum of x (or x,y) data points. Sample standard deviation of all x or y values. Correlation coefficient. x and y for Teachers 75 Mean of x or y. Linear regression y-intercept. Notes • The examples on the ...
Statistics 12 Keys 1. % t displays a menu from which you can change data points once they are entered. © 1999 TEXAS INSTRUMENTS INCORPORATED TI-30X ÙS: A Guide for 2-VAR stats). 1 3 4 2 3. % w displays the following menu that lets you enter data points (x for all xy pairs in... sx or sy Gx or Gy Gx2 or Gy2 Gxy a b r Number of (x Q y) for 1-VAR stats; Sum of x (or x,y) data points. Sample standard deviation of all x or y values. Correlation coefficient. x and y for Teachers 75 Mean of x or y. Linear regression y-intercept. Notes • The examples on the ...

Teachers Guide
Page 84
Press u " " " " " Continued Display n v Sx sx & - 5. STAT DEG n -v Sx sx 79.4 & STAT DEG n v Sx sx & --- 16.39512123 STAT DEG n v Sx sx & --- 14.66424222 STAT DEG %Gx Gx 2 --- 397. STAT DEG u © 1999 TEXAS INSTRUMENTS INCORPORATED TI-30X ÙS: A Guide for Teachers 77 STAT DEG %Gx Gx 2 ---32597. Viewing the Data (Continued) Find the number of data points (n), the mean (v), the sample standard deviation (sx), the population standard deviation (sx), the sum of the scores (Gx), and the sum of the squares (Gx2).
Press u " " " " " Continued Display n v Sx sx & - 5. STAT DEG n -v Sx sx 79.4 & STAT DEG n v Sx sx & --- 16.39512123 STAT DEG n v Sx sx & --- 14.66424222 STAT DEG %Gx Gx 2 --- 397. STAT DEG u © 1999 TEXAS INSTRUMENTS INCORPORATED TI-30X ÙS: A Guide for Teachers 77 STAT DEG %Gx Gx 2 ---32597. Viewing the Data (Continued) Find the number of data points (n), the mean (v), the sample standard deviation (sx), the population standard deviation (sx), the sum of the scores (Gx), and the sum of the squares (Gx2).
Teachers Guide
Page 113
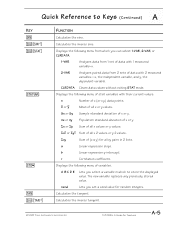
... Sum of all x values or y values. r Correlation coefficient. Calculates the inverse tangent. © 1999 TEXAS INSTRUMENTS INCORPORATED TI-30X ÙS: A Guide for random integers. Sx or Sy sx or sy Sample standard deviation of x or y. A B C D E Lets you select a variable in 2 lists. Population standard deviation of x or y. b Linear regression y-intercept. Displays the following ...2 measured variables-x, the independent variable, and y, the dependent variable. Displays the following menu of x (or x,y) data points. Calculates the inverse sine.
... Sum of all x values or y values. r Correlation coefficient. Calculates the inverse tangent. © 1999 TEXAS INSTRUMENTS INCORPORATED TI-30X ÙS: A Guide for random integers. Sx or Sy sx or sy Sample standard deviation of x or y. A B C D E Lets you select a variable in 2 lists. Population standard deviation of x or y. b Linear regression y-intercept. Displays the following ...2 measured variables-x, the independent variable, and y, the dependent variable. Displays the following menu of x (or x,y) data points. Calculates the inverse sine.


