Operators Manual EN
Page 9
... panel 37 Displaying information about chart items 38 Using the cursor on the chart panel 38 Creating routes 39 Find objects on chart panels 39 3D charts Contents | HDS Carbon Operator Manual 9
... panel 37 Displaying information about chart items 38 Using the cursor on the chart panel 38 Creating routes 39 Find objects on chart panels 39 3D charts Contents | HDS Carbon Operator Manual 9
Operators Manual EN
Page 39
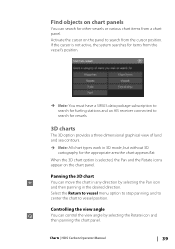
... Select the Return to vessel menu option to stop panning, and to center the chart to search from the cursor position. Charts | HDS Carbon Operator Manual 39 When the 3D chart option is not active, the system searches for the appropriate area the chart appears flat. If the cursor is selected, the Pan.... Controlling the view angle You can control the view angle by selecting the Pan icon and then panning in the desired direction. Panning the 3D chart You can move the chart in any direction by selecting the Rotate icon and then panning the chart panel. Find objects on chart panels...
... Select the Return to vessel menu option to stop panning, and to center the chart to search from the cursor position. Charts | HDS Carbon Operator Manual 39 When the 3D chart option is not active, the system searches for the appropriate area the chart appears flat. If the cursor is selected, the Pan.... Controlling the view angle You can control the view angle by selecting the Pan icon and then panning in the desired direction. Panning the 3D chart You can move the chart in any direction by selecting the Rotate icon and then panning the chart panel. Find objects on chart panels...
Operators Manual EN
Page 40
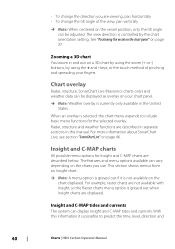
...panel" on page 46. Chart overlay Radar, structure, SonarChart Live (Navionics charts only) and weather data can be displayed as overlay on a 3D chart by using the + and - For example, raster charts are not available with Insight, so the Raster charts menu option is selected,... the chart menu expands to predict the time, level, direction and 40 Charts | HDS Carbon Operator Manual Insight and C-MAP charts All possible menu options for the selected overlay. Zooming a 3D chart You zoom in this information it is possible to include basic menu functions for Insight...
...panel" on page 46. Chart overlay Radar, structure, SonarChart Live (Navionics charts only) and weather data can be displayed as overlay on a 3D chart by using the + and - For example, raster charts are not available with Insight, so the Raster charts menu option is selected,... the chart menu expands to predict the time, level, direction and 40 Charts | HDS Carbon Operator Manual Insight and C-MAP charts All possible menu options for the selected overlay. Zooming a 3D chart You zoom in this information it is possible to include basic menu functions for Insight...
Operators Manual EN
Page 42
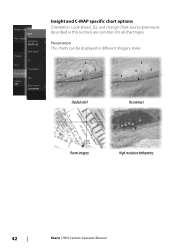
Presentation The charts can be displayed in this section) are common for all chart types. Shaded relief No contours Raster imagery High resolution bathymetry 42 Charts | HDS Carbon Operator Manual Insight and C-MAP specific chart options Orientation, Look ahead, 3D, and change Chart source (previously described in different imagery styles.
Presentation The charts can be displayed in this section) are common for all chart types. Shaded relief No contours Raster imagery High resolution bathymetry 42 Charts | HDS Carbon Operator Manual Insight and C-MAP specific chart options Orientation, Look ahead, 3D, and change Chart source (previously described in different imagery styles.
Operators Manual EN
Page 43
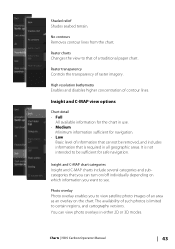
...raster imagery. Insight and C-MAP view options Chart detail • Full All available information for the chart in either 2D or 3D modes. Raster transparency Controls the transparency of contour lines. You can turn on/off individually depending on which information you to ...that you can view photo overlays in use. • Medium Minimum information sufficient for safe navigation. Charts | HDS Carbon Operator Manual 43 Raster charts Changes the view to view satellite photo images of a traditional paper chart. Shaded relief Shades seabed terrain...
...raster imagery. Insight and C-MAP view options Chart detail • Full All available information for the chart in either 2D or 3D modes. Raster transparency Controls the transparency of contour lines. You can turn on/off individually depending on which information you to ...that you can view photo overlays in use. • Medium Minimum information sufficient for safe navigation. Charts | HDS Carbon Operator Manual 43 Raster charts Changes the view to view satellite photo images of a traditional paper chart. Shaded relief Shades seabed terrain...
Operators Manual EN
Page 45
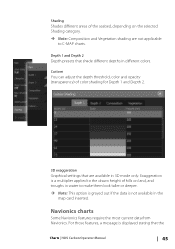
...Navionics. For those features, a message is not available in the map card inserted. Depth 1 and Depth 2 Depth presets that the Charts | HDS Carbon Operator Manual 45 Custom You can adjust the depth threshold, color and opacity (transparency) of hills on the selected Shading category. Ú Note:... shading are available in different colors. Exaggeration is a multiplier applied to the drawn height of color shading for Depth 1 and Depth 2. 3D exaggeration Graphical settings that are not applicable to make them look taller or deeper. Ú Note: This option is grayed out if the...
...Navionics. For those features, a message is not available in the map card inserted. Depth 1 and Depth 2 Depth presets that the Charts | HDS Carbon Operator Manual 45 Custom You can adjust the depth threshold, color and opacity (transparency) of hills on the selected Shading category. Ú Note:... shading are available in different colors. Exaggeration is a multiplier applied to the drawn height of color shading for Depth 1 and Depth 2. 3D exaggeration Graphical settings that are not applicable to make them look taller or deeper. Ú Note: This option is grayed out if the...
Operators Manual EN
Page 46
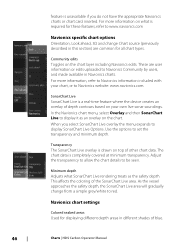
...the transparency to allow the chart details to display it as the safety depth. This affects the coloring of blue. 46 Charts | HDS Carbon Operator Manual When you do not have the appropriate Navionics charts or chart card inserted. Navionics chart settings Colored seabed areas Used for all..., and made available in this section) are user information or edits uploaded to www.navionics.com Navionics specific chart options Orientation, Look ahead, 3D and change from a simple grey/white to Navionics website: www.navionics.com. The chart data is a real-time feature where the device...
...the transparency to allow the chart details to display it as the safety depth. This affects the coloring of blue. 46 Charts | HDS Carbon Operator Manual When you do not have the appropriate Navionics charts or chart card inserted. Navionics chart settings Colored seabed areas Used for all..., and made available in this section) are user information or edits uploaded to www.navionics.com Navionics specific chart options Orientation, Look ahead, 3D and change from a simple grey/white to Navionics website: www.navionics.com. The chart data is a real-time feature where the device...
Operators Manual EN
Page 49
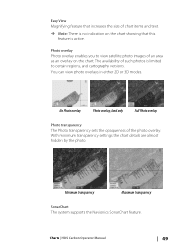
... certain regions, and cartography versions. Charts | HDS Carbon Operator Manual 49 Easy View Magnifying feature that this feature is no indication on the chart. Minimum transparency Maximum transparency SonarChart The system supports the Navionics SonarChart feature. You can view photo overlays in either 2D or 3D modes. With minimum transparency settings the chart...
... certain regions, and cartography versions. Charts | HDS Carbon Operator Manual 49 Easy View Magnifying feature that this feature is no indication on the chart. Minimum transparency Maximum transparency SonarChart The system supports the Navionics SonarChart feature. You can view photo overlays in either 2D or 3D modes. With minimum transparency settings the chart...
Operators Manual EN
Page 51
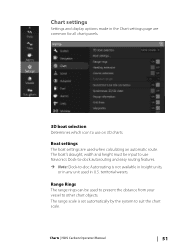
... display options made in U.S. Charts | HDS Carbon Operator Manual 51 Range Rings The range rings can be input to use Navionics Dock-to-dock autorouting and easy routing features. Ú Note: Dock-to use on 3D charts. Boat settings The boat settings are common for all chart panels. 3D boat selection Determines which icon...
... display options made in U.S. Charts | HDS Carbon Operator Manual 51 Range Rings The range rings can be input to use Navionics Dock-to-dock autorouting and easy routing features. Ú Note: Dock-to use on 3D charts. Boat settings The boat settings are common for all chart panels. 3D boat selection Determines which icon...
Operators Manual EN
Page 52
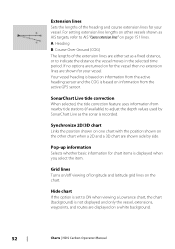
... moves in the selected time period. Grid lines Turns on a white background. 52 Charts | HDS Carbon Operator Manual If no options are turned on other chart when a 2D and a 3D chart are shown for chart items is recorded. Pop-up information Selects whether basic information for your... vessel. For setting extension line lengths on for the vessel then no extension lines are shown side by SonarChart Live as a fixed distance, or to ON when viewing a Lowrance chart...
... moves in the selected time period. Grid lines Turns on a white background. 52 Charts | HDS Carbon Operator Manual If no options are turned on other chart when a 2D and a 3D chart are shown for chart items is recorded. Pop-up information Selects whether basic information for your... vessel. For setting extension line lengths on for the vessel then no extension lines are shown side by SonarChart Live as a fixed distance, or to ON when viewing a Lowrance chart...

Operators Manual EN
Page 73
... drop-down, slg (Sonar only), xtf (Structure only*), sl2 (Sonar and Structure) or sl3 (includes StructureScan 3D). Filename Specify the name of transducer range. The Log sonar dialog is out of the recording (log). Sonar | HDS Carbon Operator Manual 73 Start recording log data You can start recording log data and save the...
... drop-down, slg (Sonar only), xtf (Structure only*), sl2 (Sonar and Structure) or sl3 (includes StructureScan 3D). Filename Specify the name of transducer range. The Log sonar dialog is out of the recording (log). Sonar | HDS Carbon Operator Manual 73 Start recording log data You can start recording log data and save the...

Operators Manual EN
Page 82
For more information about StructureScan 3D, refer to the traditional Sonar image. 82 StructureScan | HDS Carbon Operator Manual The DownScan image can be added as a DownScan image, or showing left/right side scanning. 8 StructureScan StructureScan... uses high frequencies to provide a high resolution, picture-like image of the seabed. Ú Note: You must have a StructureScan HD, TotalScan or StructureScan 3D transducer installed...
For more information about StructureScan 3D, refer to the traditional Sonar image. 82 StructureScan | HDS Carbon Operator Manual The DownScan image can be added as a DownScan image, or showing left/right side scanning. 8 StructureScan StructureScan... uses high frequencies to provide a high resolution, picture-like image of the seabed. Ú Note: You must have a StructureScan HD, TotalScan or StructureScan 3D transducer installed...
Operators Manual EN
Page 188
... Enable 129 Pairing devices 126 Wireless technology 126 Bottom lock 76 C C-MAP chart options 42 Card Copying files to 174 Charts Symbol 37 Charts 34 3D charts 39 C-MAP chart options 40 Chart compass 110, 121 Chart data 35 Chart panel 34 Chart scale 36 Course up 37 Creating routes 38...
... Enable 129 Pairing devices 126 Wireless technology 126 Bottom lock 76 C C-MAP chart options 42 Card Copying files to 174 Charts Symbol 37 Charts 34 3D charts 39 C-MAP chart options 40 Chart compass 110, 121 Chart data 35 Chart panel 34 Chart scale 36 Course up 37 Creating routes 38...
