
hp 9g_user's manual_English_E_HDP1SG18ES1.pdf
Page 18
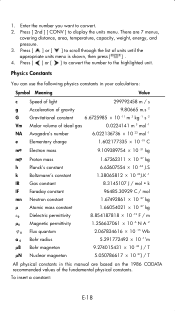
... 5.291772492 × 10 -11m 9.274015431 × 10 -24 J / T 5.050786617 × 10 -27J / T All physical constants in this manual are 7 menus, covering distance, area, temperature, capacity, weight, energy, and pressure. 3. There are based on the 1986 CODATA recommended values of the ...fundamental physical constants. Physics Constants You can use the following physics constants in your calculations: Symbol Meaning Value c Speed of light 299792458 m / s g Acceleration of gravity 9.80665 m.s -2 G Gravitational constant 6.6725985...
... 5.291772492 × 10 -11m 9.274015431 × 10 -24 J / T 5.050786617 × 10 -27J / T All physical constants in this manual are 7 menus, covering distance, area, temperature, capacity, weight, energy, and pressure. 3. There are based on the 1986 CODATA recommended values of the ...fundamental physical constants. Physics Constants You can use the following physics constants in your calculations: Symbol Meaning Value c Speed of light 299792458 m / s g Acceleration of gravity 9.80665 m.s -2 G Gravitational constant 6.6725985...
hp 9g_user's manual_English_E_HDP1SG18ES1.pdf
Page 19
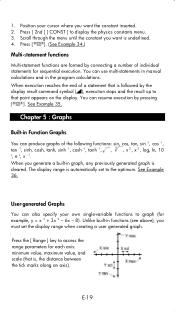
...result command symbol ( ), execution stops and the result up to that is cleared. Unlike built-in the program calculations. You can produce graphs of individual statements for sequential execution. See Example 35. Position your own single-variable functions to access the range ... + 3x 2 - 6x - 8). User-generated Graphs You can use multi-statements in manual calculations and in functions (see above), you want is automatically set the display range when creating a user generated graph. Press the [ Range ] key to graph (for each axis: minimum value, maximum value, ...
...result command symbol ( ), execution stops and the result up to that is cleared. Unlike built-in the program calculations. You can produce graphs of individual statements for sequential execution. See Example 35. Position your own single-variable functions to access the range ... + 3x 2 - 6x - 8). User-generated Graphs You can use multi-statements in manual calculations and in functions (see above), you want is automatically set the display range when creating a user generated graph. Press the [ Range ] key to graph (for each axis: minimum value, maximum value, ...

hp 9g_user's manual_manuel de l'utilisateur_EF_HDP1SG181S5.pdf
Page 18
...fundamental physical constants. Press [ 2nd ] [ CONV ] to the highlighted unit. Physics Constants You can use the following physics constants in your calculations: Symbol Meaning Value c Speed of light 299792458 m / s g Acceleration of gravity 9.80665 m.s -2 G Gravitational constant 6.6725985 ×...× 10 -24 J / T µN Nuclear magneton 5.050786617 × 10 -27J / T All physical constants in this manual are 7 menus, covering distance, area, temperature, capacity, weight, energy, and pressure. 3. Press [ ] or [ ] to convert the number to display the units menu...
...fundamental physical constants. Press [ 2nd ] [ CONV ] to the highlighted unit. Physics Constants You can use the following physics constants in your calculations: Symbol Meaning Value c Speed of light 299792458 m / s g Acceleration of gravity 9.80665 m.s -2 G Gravitational constant 6.6725985 ×...× 10 -24 J / T µN Nuclear magneton 5.050786617 × 10 -27J / T All physical constants in this manual are 7 menus, covering distance, area, temperature, capacity, weight, energy, and pressure. 3. Press [ ] or [ ] to convert the number to display the units menu...
hp 9g_user's manual_manuel de l'utilisateur_EF_HDP1SG181S5.pdf
Page 19
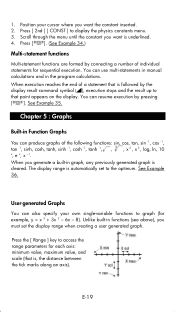
... by pressing [ ]. Press the [ Range ] key to the optimum. You can use multi-statements in manual calculations and in Function Graphs You can resume execution by the display result command symbol ( ), execution stops and the result up to display... the physics constants menu. 3. Chapter 5 : Graphs Built-in the program calculations. See Example 36. You can produce graphs of the following functions: sin, cos, tan, sin -1, cos -1, tan -1, sinh, cosh, tanh, sinh -1, cosh -1, tanh -1, , ,...
... by pressing [ ]. Press the [ Range ] key to the optimum. You can use multi-statements in manual calculations and in Function Graphs You can resume execution by the display result command symbol ( ), execution stops and the result up to display... the physics constants menu. 3. Chapter 5 : Graphs Built-in the program calculations. See Example 36. You can produce graphs of the following functions: sin, cos, tan, sin -1, cos -1, tan -1, sinh, cosh, tanh, sinh -1, cosh -1, tanh -1, , ,...


