hp 9g_user's manual_English_E_HDP1SG18ES1.pdf
Page 19
..., the distance between the tick marks along an axis). You can use multi-statements in manual calculations and in Function Graphs You can produce graphs of individual statements for each axis: minimum value, maximum value, and scale (that point appears... , x 3 , log, ln, 10 x, e x, x -1. Unlike built-in functions (see above), you generate a built-in graph, any previously generated graph is automatically set the display range when creating a user generated graph. See Example 35. The display range is cleared. When you must set to display the physics constants menu. 3. Press...
..., the distance between the tick marks along an axis). You can use multi-statements in manual calculations and in Function Graphs You can produce graphs of individual statements for each axis: minimum value, maximum value, and scale (that point appears... , x 3 , log, ln, 10 x, e x, x -1. Unlike built-in functions (see above), you generate a built-in graph, any previously generated graph is automatically set the display range when creating a user generated graph. See Example 35. The display range is cleared. When you must set to display the physics constants menu. 3. Press...
hp 9g_user's manual_manuel de l'utilisateur_EF_HDP1SG181S5.pdf
Page 19
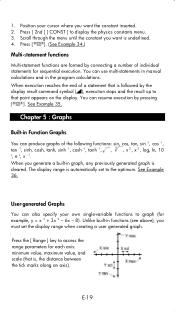
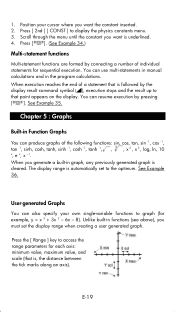
...cosh, tanh, sinh -1, cosh -1, tanh -1, , , x 2 , x 3 , log, ln, 10 x, e x, x -1. Chapter 5 : Graphs Built-in Function Graphs You can use multi-statements in manual calculations and in the program calculations. The display range is , the distance between the tick marks along an axis). Press the [ Range ] key to that... See Example 36. See Example 35. Unlike built-in graph, any previously generated graph is followed by connecting a number of a statement that point appears on the display. User-generated Graphs You can resume execution by pressing [ ]. Scroll through the...
...cosh, tanh, sinh -1, cosh -1, tanh -1, , , x 2 , x 3 , log, ln, 10 x, e x, x -1. Chapter 5 : Graphs Built-in Function Graphs You can use multi-statements in manual calculations and in the program calculations. The display range is , the distance between the tick marks along an axis). Press the [ Range ] key to that... See Example 36. See Example 35. Unlike built-in graph, any previously generated graph is followed by connecting a number of a statement that point appears on the display. User-generated Graphs You can resume execution by pressing [ ]. Scroll through the...


