HP hp39gPlus - 39G+ Graphing Calculator Support and Manuals
Get Help and Manuals for this Hewlett-Packard item
View All Support Options Below
Free HP hp39gPlus manuals!
Problems with HP hp39gPlus?
Ask a Question
Free HP hp39gPlus manuals!
Problems with HP hp39gPlus?
Ask a Question
Popular HP hp39gPlus Manual Pages
User Guide - Page 3
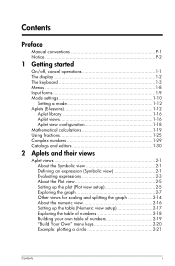
Contents
Preface
Manual conventions P-1 Notice P-2
1 Getting started
On/off, cancel operations 1-1 The display 1-2 The keyboard 1-3 Menus 1-8 Input forms 1-9 Mode settings 1-10
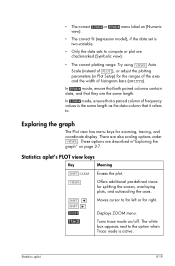
Setting a mode 1-12...Symbolic view 2-1 Evaluating expressions 2-3 About the Plot view 2-5 Setting up the plot (Plot view setup 2-5 Exploring the graph 2-7 Other views for scaling and splitting the graph 2-14...
User Guide - Page 4
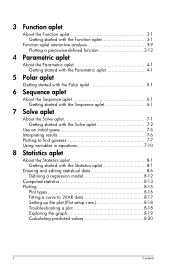
... the Statistics aplet 8-1 Getting started with the Statistics aplet 8-1
Entering and editing statistical data 8-6 Defining a regression model 8-12
Computed statistics 8-13 Plotting 8-15
Plot types 8-16 Fitting a curve to 2VAR data 8-17 Setting up the plot (Plot setup view 8-18 Trouble-shooting a plot 8-18 Exploring the graph 8-19 Calculating predicted values 8-20
ii
Contents
User Guide - Page 29
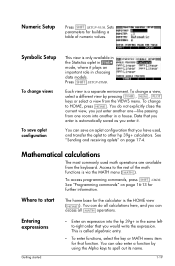
Sets
parameters for
further information. To change a view,
select a different view by using the Alpha keys to other hp 39g+ calculators. You can save aplet configuration
This view is automatically saved as you
enter is only available in
the Statistics aplet in
mode, where it .
See "Programming commands" on page 17-4.
Press
SETUP... in choosing
data models. See "Sending ...
User Guide - Page 48
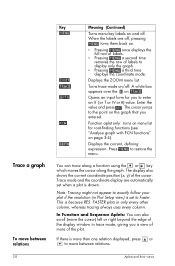
... aplet only: turns on menu list for you to exactly follow your plot if the resolution (in Plot Setup view) is because RES: FASTER plots in trace mode, giving you entered. Note: Tracing might not appear...with FCN functions" on the graph that you a view of more of the cursor.
This is set when a plot is more than one relation displayed, press or to
display only the graph.
•...
User Guide - Page 49
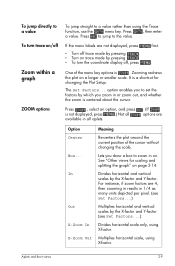
...changing the Plot Setup. Divides horizontal and vertical scales by the X-factor and Y-factor (see Set Factors...)
Multiplies horizontal and vertical scales by the X-factor and Y-factor.
The Set Factors... To jump...
To jump straight to zoom in on a larger or smaller scale. Press to jump to set the factors by pressing
.
• To turn trace on/off , press
.
option enables...
User Guide - Page 61
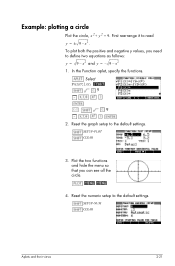
... functions and hide the menu so that you need to read y = ± 9 - Reset the numeric setup to the default settings. SETUP-NUM
CLEAR
Aplets and their views
2-21 x2 1. SETUP-PLOT
CLEAR
3. x2 .
Reset the graph setup to the default settings. First rearrange it to define two equations as follows: y = 9 - x2 and y = - 9 - Example: plotting a circle
Plot...
User Guide - Page 64
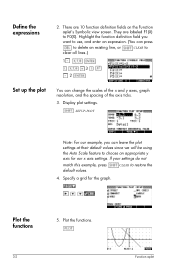
...graph resolution, and the spacing of the axis ticks. 3.
Plot the functions.
3-2
Function aplet SETUP-PLOT
Note: For our example, you want to use, and enter an expression. (You can...an appropriate y axis for the graph. Specify a grid for our x axis settings. Define the expressions
2.
If your settings do not
match this example, press default values. CLEAR to F0(X). There are...
User Guide - Page 106
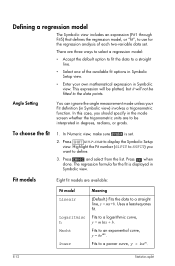
... Symbolic view includes an expression (Fit1 through Fit5) that defines the regression model, or "fit", to use for the fit is set .
In this case, you
want to a straight line.
• Select one of each two-variable data set .
2. Press
SETUP-SYMB to be fitted to an exponential curve, y = bemx. Press when
done. Uses...
User Guide - Page 107
..., make sure
is the saturation value for the desired data set .
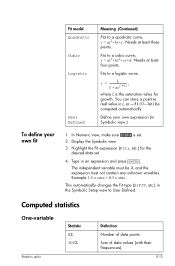
2. Highlight the Fit expression (Fit1, etc.) for growth. Example: 1.5 × cos x + 0.3 × sin x . To define your own expression (in Symbolic view.)
1. Sum of data points.
Define your own fit
Fit model Quadratic Cubic Logistic
User Defined
Meaning (Continued)
Fits to User...
User Guide - Page 109
... the plot type in
Plot Setup (
SETUP-PLOT).
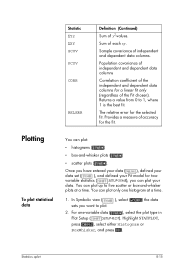
You can plot your Fit model for the selected fit.
Population...SETUP-SYMB), you can plot up to five scatter or box-and-whisker
plots at a time.
1. In Symbolic view (
), select (
sets you have entered your data (
), defined your
data set...error for two- Sum of y2-values.
Sample covariance of independent and dependent data columns.
User Guide - Page 111
..., and it does depend on the Fit model you have chosen.
8-17
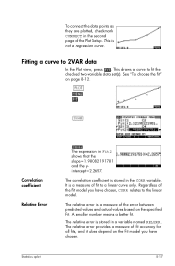
This draws a curve to 2VAR data
In the Plot view, press . Fitting a curve to fit the checked two-variable data set(s). See "To choose the fit" on the specified Fit. Correlation coefficient Relative Error
Statistics aplet
The expression in Fit2 shows...
User Guide - Page 112

...setup view)
The Plot Setup view (
SETUP-PLOT) sets most of the
same plotting parameters as how the data is not the regression curve. Press
to change the highlighted setting. Histogram range
HRNG enables you to specify the width of a histogram bar.
Trouble...RELERR variables after
you plot a set of statistics, you have problems plotting, check that you must press
to access
...
User Guide - Page 113
...menu. There are the same length. Moves cursor to compute or plot are described in Plot Setup) for the ranges of the axes and the width of frequency
values is the same length... • The correct
or
menu label on (Numeric
view).
• The correct fit (regression model), if the data set is active. Try using
Auto
Scale (instead of
), or adjust the plotting
parameters (in "Exploring ...
User Guide - Page 235
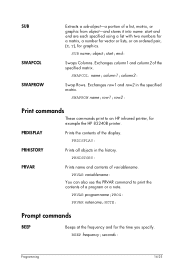
... history. PRHISTORY:
PRVAR
Prints name and contents of a program or a note. PRVAR variablename:
You can also use the PRVAR command to an HP infrared printer, for example the HP 82240B printer.
SWAPROW name;row1;row2:
Print commands
These commands print to print the contents of variablename. PRDISPLAY
Prints the contents of the display. PRDISPLAY...
User Guide - Page 293
... curve (fit) models 8-12 saving data 8-10 sorting data 8-11 specifying angle setting 8-12 toggling between one-variable and two-variable 8-12 tracing plots 8-19 troubleshooting with plots 8-18... syntax errors 16-7
T
table navigate around 3-8 numeric values 3-7 numeric view setup 2-17
tangent 11-4 inverse hyperbolic 11-8
Taylor polynomial 11-7 tickmarks for plotting 2-6 time 11-14
setting 16-26...
HP hp39gPlus Reviews
We have not received any reviews for HP yet.