
User Guide
Page 5
Quick-Start TURNING POWER ON AND OFF USING MODES BASIC CALCULATIONS REPLAY FEATURE FRACTION CALCULATIONS EXPONENTS GRAPH FUNCTIONS DUAL GRAPH DYNAMIC GRAPH TABLE FUNCTION 20050401
Quick-Start TURNING POWER ON AND OFF USING MODES BASIC CALCULATIONS REPLAY FEATURE FRACTION CALCULATIONS EXPONENTS GRAPH FUNCTIONS DUAL GRAPH DYNAMIC GRAPH TABLE FUNCTION 20050401
User Guide
Page 6
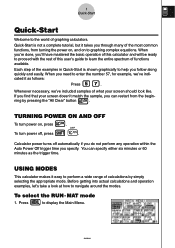
...mode m 1. Press to enter the number 57, for example, we 've included samples of graphing calculators. Each step of the most common functions, from the begin- o ning by simply selecting the appropriate mode. Calculator power turns off , press . 1 Quick-Start Quick-Start Welcome to the world of what... a wide range of functions available. When you 'll have mastered the basic operation of this calculator and will be ready to proceed with the rest of this user's guide to graphing complex equations. You can restart from turning the power on, and on , press . USING ...
...mode m 1. Press to enter the number 57, for example, we 've included samples of graphing calculators. Each step of the most common functions, from the begin- o ning by simply selecting the appropriate mode. Calculator power turns off , press . 1 Quick-Start Quick-Start Welcome to the world of what... a wide range of functions available. When you 'll have mastered the basic operation of this calculator and will be ready to proceed with the rest of this user's guide to graphing complex equations. You can restart from turning the power on, and on , press . USING ...

User Guide
Page 11
... (G-SLV). 20050401 distance from the calculator setup in effect immediately following graphing examples are performed starting from origin: r). Example 1: To graph Y = X(X + 1)(X - 2) m 1. v (v+b) (v -c)w 6 w 4. Press (DRAW) or to highlight w GRAPH, and then press . 3. Use defc to draw the graph. vertical axis: y) or polar coordinates (angle: θ ; Example 2: To determine the roots of this calculator makes it possible to draw...
... (G-SLV). 20050401 distance from the calculator setup in effect immediately following graphing examples are performed starting from origin: r). Example 1: To graph Y = X(X + 1)(X - 2) m 1. v (v+b) (v -c)w 6 w 4. Press (DRAW) or to highlight w GRAPH, and then press . 3. Use defc to draw the graph. vertical axis: y) or polar coordinates (angle: θ ; Example 2: To determine the roots of this calculator makes it possible to draw...

User Guide
Page 21
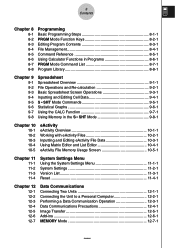
... 5-11 Graphing Sample Graphs 5-1-1 Controlling What Appears on a Graph Screen 5-2-1 Drawing a Graph 5-3-1 Storing a Graph in Picture Memory 5-4-1 Drawing Two Graphs on the Same Screen 5-5-1 Manual Graphing 5-6-1 Using Tables 5-7-1 Dynamic Graphing 5-8-1 Graphing a Recursion Formula 5-9-1 Changing the Appearance of a Graph 5-10-1 Function Analysis 5-11-1 Chapter 6 6-1 6-2 6-3 6-4 6-5 6-6 6-7 Statistical Graphs and Calculations Before Performing Statistical Calculations 6-1-1 Calculating and Graphing Single-Variable Statistical Data 6-2-1 Calculating and Graphing Paired-Variable...
... 5-11 Graphing Sample Graphs 5-1-1 Controlling What Appears on a Graph Screen 5-2-1 Drawing a Graph 5-3-1 Storing a Graph in Picture Memory 5-4-1 Drawing Two Graphs on the Same Screen 5-5-1 Manual Graphing 5-6-1 Using Tables 5-7-1 Dynamic Graphing 5-8-1 Graphing a Recursion Formula 5-9-1 Changing the Appearance of a Graph 5-10-1 Function Analysis 5-11-1 Chapter 6 6-1 6-2 6-3 6-4 6-5 6-6 6-7 Statistical Graphs and Calculations Before Performing Statistical Calculations 6-1-1 Calculating and Graphing Single-Variable Statistical Data 6-2-1 Calculating and Graphing Paired-Variable...
User Guide
Page 22
... in Programs 8-6-1 PRGM Mode Command List 8-7-1 Program Library 8-8-1 Chapter 9 9-1 9-2 9-3 9-4 9-5 9-6 9-7 9-8 Spreadsheet Spreadsheet Overview 9-1-1 File Operations and Re-calculation 9-2-1 Basic Spreadsheet Screen Operations 9-3-1 Inputting and Editing Cell Data 9-4-1 S • SHT Mode Commands 9-5-1 Statistical Graphs 9-6-1 Using the CALC Function 9-7-1 Using Memory in the S • SHT Mode 9-8-1 Chapter 10 10-1 10-2 10-3 10-4 10-5 eActivity eActivity...
... in Programs 8-6-1 PRGM Mode Command List 8-7-1 Program Library 8-8-1 Chapter 9 9-1 9-2 9-3 9-4 9-5 9-6 9-7 9-8 Spreadsheet Spreadsheet Overview 9-1-1 File Operations and Re-calculation 9-2-1 Basic Spreadsheet Screen Operations 9-3-1 Inputting and Editing Cell Data 9-4-1 S • SHT Mode Commands 9-5-1 Statistical Graphs 9-6-1 Using the CALC Function 9-7-1 Using Memory in the S • SHT Mode 9-8-1 Chapter 10 10-1 10-2 10-3 10-4 10-5 eActivity eActivity...
User Guide
Page 25
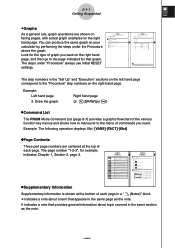
... in a " (Notes)" block. * indicates a note about topic covered in the same section as the note. 20050401 You can also perform statistical calculations and graph statistical data using the functions. Text Screen Graph Screen The contents of hyperbolic functions. • Command Input Example: Selecting inputs the sinh command. • Direct Command Execution Example: Selecting...
... in a " (Notes)" block. * indicates a note about topic covered in the same section as the note. 20050401 You can also perform statistical calculations and graph statistical data using the functions. Text Screen Graph Screen The contents of hyperbolic functions. • Command Input Example: Selecting inputs the sinh command. • Direct Command Execution Example: Selecting...
User Guide
Page 30
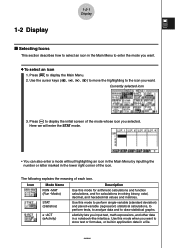
...the lower right corner of each icon. eActivity lets you want to draw statistical graphs. Use this mode to perform single-variable (standard deviation) and paired-variable (regression) statistical calculations, to perform tests, to analyze data and to store text or formulas, or...Description RUN • MAT (Run • Matrix) STAT (Statistics) e • ACT (eActivity) Use this mode for arithmetic calculations and function calculations, and for calculations involving binary, octal, decimal, and hexadecimal values and matrices. Here we will enter the STAT mode. • You can also enter...
...the lower right corner of each icon. eActivity lets you want to draw statistical graphs. Use this mode to perform single-variable (standard deviation) and paired-variable (regression) statistical calculations, to perform tests, to analyze data and to store text or formulas, or...Description RUN • MAT (Run • Matrix) STAT (Statistics) e • ACT (eActivity) Use this mode for arithmetic calculations and function calculations, and for calculations involving binary, octal, decimal, and hexadecimal values and matrices. Here we will enter the STAT mode. • You can also enter...

User Guide
Page 31
... mode to generate a numeric table of graphs. Use this mode to store functions, to perform spreadsheet calculations. In addition to the variables in commands and S • SHT mode commands, you can also perform statistical calculations and graph statistical data using the functions. Use this mode to draw graphs of a graph by changing the values assigned to...
... mode to generate a numeric table of graphs. Use this mode to store functions, to perform spreadsheet calculations. In addition to the variables in commands and S • SHT mode commands, you can also perform statistical calculations and graph statistical data using the functions. Use this mode to draw graphs of a graph by changing the values assigned to...
User Guide
Page 32
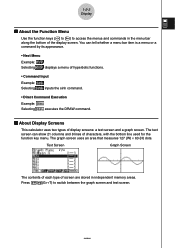
...uses an area that measures 127 (W) × 63 (H) dots. 1-2-3 Display k About the Function Menu Use the function keys (1 to 6) to switch between the graph screen and text screen. 20050401 The text screen can tell whether a menu bar item is a menu or a command by its appearance. • Next Menu Example:... functions. • Command Input Example: Selecting inputs the sinh command. • Direct Command Execution Example: Selecting executes the DRAW command. k About Display Screens This calculator uses two types of display screens: a text screen and a graph screen.
...uses an area that measures 127 (W) × 63 (H) dots. 1-2-3 Display k About the Function Menu Use the function keys (1 to 6) to switch between the graph screen and text screen. 20050401 The text screen can tell whether a menu bar item is a menu or a command by its appearance. • Next Menu Example:... functions. • Command Input Example: Selecting inputs the sinh command. • Direct Command Execution Example: Selecting executes the DRAW command. k About Display Screens This calculator uses two types of display screens: a text screen and a graph screen.
User Guide
Page 34
... performing an internal operation. 20050401 This black box tells you that the calculator is busy drawing a graph or executing a long, complex calculation or program, a black box "k" flashes in each applicable section of the display. Indicates: 0ABCDEF1(16), which are described in the upper right corner of this ...
... performing an internal operation. 20050401 This black box tells you that the calculator is busy drawing a graph or executing a long, complex calculation or program, a black box "k" flashes in each applicable section of the display. Indicates: 0ABCDEF1(16), which are described in the upper right corner of this ...
User Guide
Page 53
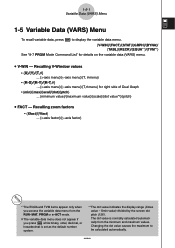
...axis factor}/{y-axis factor} *1The EQUA and TVM items appear only when you press J while binary, octal, decimal, or hexadecimal is normally calculated automatically from the RUN • MAT, PRGM or e • ACT mode. # The variable data menu does not appear if you access... the variable data menu. {V-WIN}/{FACT}/{STAT}/{GRPH}/{DYNA}/ {TABL}/{RECR}/{EQUA*1}/{TVM*1} See "8-7 PRGM Mode Command List" for right side of Dual Graph • {min}/{max}/{scal}/{dot}/{ptch} ... {minimum value}/{maximum value}/{scale}/{dot value*2}/{pitch} u FACT - Recalling V-Window values • {X}/{Y}/{T,&#...
...axis factor}/{y-axis factor} *1The EQUA and TVM items appear only when you press J while binary, octal, decimal, or hexadecimal is normally calculated automatically from the RUN • MAT, PRGM or e • ACT mode. # The variable data menu does not appear if you access... the variable data menu. {V-WIN}/{FACT}/{STAT}/{GRPH}/{DYNA}/ {TABL}/{RECR}/{EQUA*1}/{TVM*1} See "8-7 PRGM Mode Command List" for right side of Dual Graph • {min}/{max}/{scal}/{dot}/{ptch} ... {minimum value}/{maximum value}/{scale}/{dot value*2}/{pitch} u FACT - Recalling V-Window values • {X}/{Y}/{T,&#...

User Guide
Page 56
...- Recalling Equation Coefficients and Solutions*4 *5 • {S-Rlt}/{S-Cof} ... origin of {an }/{bn}/{cn} recursion formula convergence/divergence graph (WEB graph) • {Reslt *2} ... {matrix of compounding periods per year} *1 An error occurs when there is no function or recursion...with two through six unknowns*6 • {P-Rlt}/{P-Cof} ... matrix of {solution}/{coefficients} for the equation - Recalling Financial Calculation Data • {n}/{I%}/{PV}/{PMT}/{FV} ... {payment periods (installments)}/{interest (%)}/{principal}/{payment amount}/ {account balance or principal plus...
...- Recalling Equation Coefficients and Solutions*4 *5 • {S-Rlt}/{S-Cof} ... origin of {an }/{bn}/{cn} recursion formula convergence/divergence graph (WEB graph) • {Reslt *2} ... {matrix of compounding periods per year} *1 An error occurs when there is no function or recursion...with two through six unknowns*6 • {P-Rlt}/{P-Cof} ... matrix of {solution}/{coefficients} for the equation - Recalling Financial Calculation Data • {n}/{I%}/{PV}/{PMT}/{FV} ... {payment periods (installments)}/{interest (%)}/{principal}/{payment amount}/ {account balance or principal plus...
User Guide
Page 59
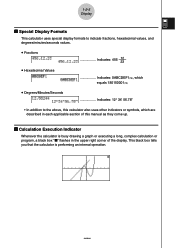
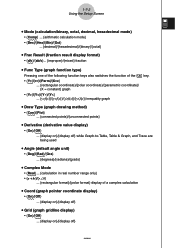
1-7-2 Using the Setup Screen u Mode (calculation/binary, octal, decimal, hexadecimal mode) • {Comp} ... {arithmetic calculation mode} • {Dec}/{Hex}/{Bin}/{Oct} ... {decimal}/{hexadecimal}/{binary}/{octal} u Frac Result (fraction result display format) • {d/c}/{ab/c}... {improper}/{mixed} fraction u Func Type (graph function type) Pressing one of the following function keys also switches the function of the v key. • {Y=}/{r=}/{Parm}/{X=c} ... {rectangular coordinate}/{polar coordinate}/{parametric coordinate}/ {X = constant} graph • {Y>}/{Yf(x)}/{y
1-7-2 Using the Setup Screen u Mode (calculation/binary, octal, decimal, hexadecimal mode) • {Comp} ... {arithmetic calculation mode} • {Dec}/{Hex}/{Bin}/{Oct} ... {decimal}/{hexadecimal}/{binary}/{octal} u Frac Result (fraction result display format) • {d/c}/{ab/c}... {improper}/{mixed} fraction u Func Type (graph function type) Pressing one of the following function keys also switches the function of the v key. • {Y=}/{r=}/{Parm}/{X=c} ... {rectangular coordinate}/{polar coordinate}/{parametric coordinate}/ {X = constant} graph • {Y>}/{Yf(x)}/{y

User Guide
Page 236
... speed adjustment menu without changing anything, press w. # Press !6(G↔T) to return to display the Setup screen. 2. Select the graphing method. 1(Norm) ... k Graph Calculation DOT Switching Function Use this function to specify drawing of the Dynamic Graph draw operation is value for Dynamic Func Y= graphic only. 1. Draws every other dot. Press !m(SET UP) to the...
... speed adjustment menu without changing anything, press w. # Press !6(G↔T) to return to display the Setup screen. 2. Select the graphing method. 1(Norm) ... k Graph Calculation DOT Switching Function Use this function to specify drawing of the Dynamic Graph draw operation is value for Dynamic Func Y= graphic only. 1. Draws every other dot. Press !m(SET UP) to the...
User Guide
Page 316
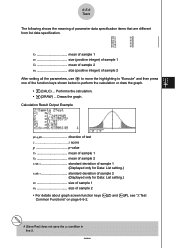
...1(Z) and 2(P), see "Z Test Common Functions" on page 6-5-2. # [Save Res] does not save the µ1 condition in line 2. 20050401 Draws the graph. Calculation Result Output Example µ1Gµ2 direction of test z z score p p-value o1 mean of sample 1 o2 mean of sample 2 n2 size (...positive integer) of sample 2 After setting all the parameters, use c to move the highlighting to perform the calculation or draw the graph. • 1(CALC) ... 6-5-6 Tests The following shows the meaning of parameter data specification items that are different from list data specification.
...1(Z) and 2(P), see "Z Test Common Functions" on page 6-5-2. # [Save Res] does not save the µ1 condition in line 2. 20050401 Draws the graph. Calculation Result Output Example µ1Gµ2 direction of test z z score p p-value o1 mean of sample 1 o2 mean of sample 2 n2 size (...positive integer) of sample 2 After setting all the parameters, use c to move the highlighting to perform the calculation or draw the graph. • 1(CALC) ... 6-5-6 Tests The following shows the meaning of parameter data specification items that are different from list data specification.
User Guide
Page 317
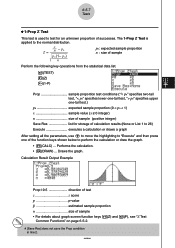
...-tail test, "> p0" specifies upper one of the function keys shown below to perform the calculation or draw the graph. • 1(CALC) ... Draws the graph. Z = x n - p0 p0(1- Performs the calculation. • 6(DRAW) ... Calculation Result Output Example PropG0.5 direction of test z z score p p-value p estimated sample proportion... the normal distribution. The 1-Prop Z Test is used to test for storage of calculation results (None or List 1 to 26) Execute executes a calculation or draws a graph After setting all the parameters, use c to move the highlighting to "Execute" and...
...-tail test, "> p0" specifies upper one of the function keys shown below to perform the calculation or draw the graph. • 1(CALC) ... Draws the graph. Z = x n - p0 p0(1- Performs the calculation. • 6(DRAW) ... Calculation Result Output Example PropG0.5 direction of test z z score p p-value p estimated sample proportion... the normal distribution. The 1-Prop Z Test is used to test for storage of calculation results (None or List 1 to 26) Execute executes a calculation or draws a graph After setting all the parameters, use c to move the highlighting to "Execute" and...

User Guide
Page 329
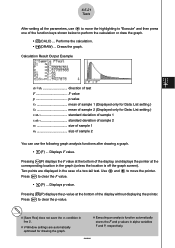
... p-value at the corresponding location in alpha variables C and P, respectively. 20050401 Press J to perform the calculation or draw the graph. • 1(CALC) ... Draws the graph. Press J to clear the p-value. # Pressing 6('MAT) while a calculation result is off the graph screen). 6-5-19 Tests After setting all the parameters, use the following V-Window settings are used for...
... p-value at the corresponding location in alpha variables C and P, respectively. 20050401 Press J to perform the calculation or draw the graph. • 1(CALC) ... Draws the graph. Press J to clear the p-value. # Pressing 6('MAT) while a calculation result is off the graph screen). 6-5-19 Tests After setting all the parameters, use the following V-Window settings are used for...
User Guide
Page 331
...displays the F value at the bottom of the display without displaying the pointer. Press J to move the highlighting to perform the calculation or draw the graph. • 1(CALC) ... Press J to clear the p-value. # [Save Res] does not save the σ1 ...settings are displayed in alpha variables F and P, respectively. 20050401 Performs the calculation. • 6(DRAW) ... Displays F value. 6-5-21 Tests After setting all the parameters, use the following graph analysis functions after drawing a graph. • 1(F) ... Two points are automatically optimized for Data: List setting...
...displays the F value at the bottom of the display without displaying the pointer. Press J to move the highlighting to perform the calculation or draw the graph. • 1(CALC) ... Press J to clear the p-value. # [Save Res] does not save the σ1 ...settings are displayed in alpha variables F and P, respectively. 20050401 Performs the calculation. • 6(DRAW) ... Displays F value. 6-5-21 Tests After setting all the parameters, use the following graph analysis functions after drawing a graph. • 1(F) ... Two points are automatically optimized for Data: List setting...
User Guide
Page 349
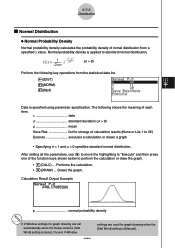
... Wind] setting is [Manual]. Current V-Window 20050401 settings are set automatically when the Setup screen's [Stat Wind] setting is applied to 26) Execute executes a calculation or draws a graph • Specifying σ = 1 and µ = 0 specifies standard normal distribution. After setting all the parameters, use c to move the highlighting to "Execute" and then press...
... Wind] setting is [Manual]. Current V-Window 20050401 settings are set automatically when the Setup screen's [Stat Wind] setting is applied to 26) Execute executes a calculation or draws a graph • Specifying σ = 1 and µ = 0 specifies standard normal distribution. After setting all the parameters, use c to move the highlighting to "Execute" and then press...

User Guide
Page 353
... the meaning of the function keys shown below are used for storage of calculation results (None or List 1 to 26) Execute executes a calculation or draws a graph After setting all the parameters, use c to move the highlighting to perform the calculation or draw the graph. • 1(CALC) ... 6-7-7 Distribution k Student-t Distribution u Student-t Probability Density Student-t probability density...
... the meaning of the function keys shown below are used for storage of calculation results (None or List 1 to 26) Execute executes a calculation or draws a graph After setting all the parameters, use c to move the highlighting to perform the calculation or draw the graph. • 1(CALC) ... 6-7-7 Distribution k Student-t Distribution u Student-t Probability Density Student-t probability density...


