Texas Instruments TINSPIRE Support Question
Texas Instruments TINSPIRE Support Question
Find answers below for this question about Texas Instruments TINSPIRE.Need a Texas Instruments TINSPIRE manual? We have 5 online manuals for this item!
Question posted by sunfish25 on December 5th, 2011
Finding Ph
How do I use the calculator to find the pH? This thing came without ANY directions.
Thank you.
Current Answers
Related Texas Instruments TINSPIRE Manual Pages
Reference Guide - Page 54
...8482; Reference Guide
Catalog > Catalog > Catalog > Catalog >
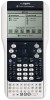
If it finds such an interval, it returns undef. Use the interpolate() function to approximate the function f at xValue.
otherwise, it...increasing or decreasing numbers, but this function may return a value even when it is used to calculate the function values for the xvaluelist:
xValue can be of equal dimension | 2 and...
Reference Guide - Page 76
Catalog >
npv( )
npv(InterestRate,CFO,CFList[,CFFreq])
Financial function that calculates net present value; CF0 is the corresponding element of CFList.
CFFreq is a list in the two matrices.
it must be positive integers < 10,000.
InterestRate ...
Data Collection Guidebook - Page 3
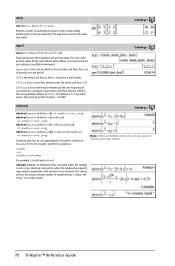
...Data Set 42 Changing a Data Set Name 42 Adding a New Column 43 Adding a New Calculated Column 45 Striking and Restoring Data 47
Analyzing Data in Graph View 51 Viewing Data for ...51 Interpolating the Value Between Two Data Points 53 Finding the Slope 53 Finding the Area Under a Data Plot 54 Removing Analysis Options 60
Using Advanced Data Collection Options 63 Setting Up Offline Sensors...
Data Collection Guidebook - Page 49
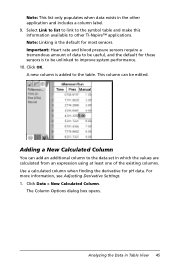
Use a calculated column when finding the derivative for most sensors. The Column Options dialog box opens. Click OK.
For more information, see Adjusting Derivative Settings. 1. Adding a New Calculated Column
You can be unlinked to the table. Important: Heart rate and blood pressure sensors require a tremendous amount of the existing columns.
Select Link to ...
Data Collection Guidebook - Page 59

You can find the statistics for Graph dialog box. Leave the graph unselected to determine the statistics associated with the plotted data.
To generate statistics:
1. For example, run1.Pressure. The values are calculated. The Stats dialog box opens.
4.
Review the data. Generating Statistics Use this option to examine all the data or a selected region...
Data Collection Guidebook - Page 60

... Quadratic Cubic Quartic Power (ax^b) Exponential (ab^x) Logarithmic Sinusoidal
Logistic (d 0) Natural Exponential Proportional
Calculated in the form: y = m*x + b y = a*x^2 + b*x + c y = a*x^3 + b*x^2 + c*x + d y = a*x^4 + b*x^3 + c*x^2 + d*x + e y = a*x^b y = a*b^x
y = a + b*...
Generating a Curve Fit Use Curve Fit to find the best curve fit to examine a specific area.
2. Click OK. The...
Data Collection Guidebook - Page 77
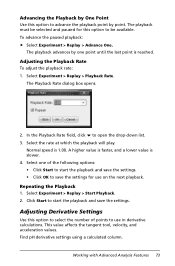
... of points to open the drop-down list.
3. The Playback Rate dialog box opens.
2. Select Experiment > Replay > Start Playback. 2. Find pH derivative settings using a calculated column.
In the Playback Rate field, click ¤ to use on the next playback. Click Start to start the playback and save the settings. • Click OK to start the...
Getting Started - Page 38
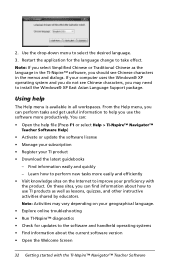
...8226; Check for the language change to select the desired language. 3. 2. Use the drop-down menu to take effect. Find information easily and quickly - On these sites, you do not see Chinese...the application for updates to the software and handheld operating systems • Find information about how to use the software more easily and efficiently • Visit knowledge sites on your ...
Teacher Software Guidebook - Page 44

... the application for updates to the software and handheld operating systems • Find information about how to improve your computer uses the Windows® XP operating system and you may need to select the desired language. 3. Using help you can find information about the current software version • Open the Welcome Screen
32 Getting...
Teacher Software Guidebook - Page 248
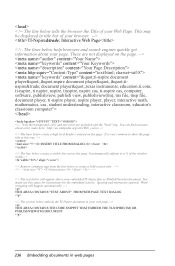
Interactive Web Page
INSERT TITLE FROM DIALOG
THIS AREA CONTAINS "TEXT ABOVE" FROM WEB PAGE TEXT DIALOG.
TI-Nspire™ THIS AREA CONTAINS THE CODE SNIPPET THAT EMBEDS THE TI-NSPIRE(TM) OR PUBLISHVIEW(TM) DOCUMENT
236 Embedding documents in web pages
Teacher Software Guidebook - Page 407
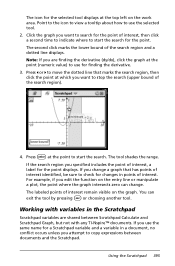
...marks the search region, then click the point at the point (numeric value) to use for finding the derivative. 3. For example, if you are shared between documents and the Scratchpad. .... Working with any TI-Nspire™ documents.
Using the Scratchpad 395 Click the graph you want to copy expressions between Scratchpad Calculate and Scratchpad Graph, but not with variables in ...
Teacher Software Guidebook - Page 448

..., type 1.7 r 4.2, and press ·.
2. Reuse the last answer to find the yield.
-
Type 147/ans, and press Enter to Ans or any system variable. Note: Do not link to find the yield.
436 Using Variables
You can use the area to create a chain of calculations. Doing so could prevent the variable from being updated by...
Teacher Software Guidebook - Page 529

... As you move to the next point, Graphs & Geometry calculates the measurement of a line, ray, segment, or vector 1. If you change ...the path to the next point, a dotted line shows the path used for angle measurement.
3. The value of the angle. and 180-... angle. The measurement remains visible and close to the next point. Finding the slope of the angle and displays it , change it on ...
Teacher Software Guidebook - Page 645
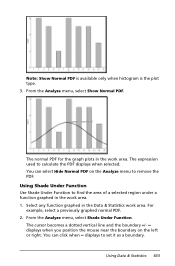
... right. Note: Show Normal PDF is available only when histogram is the plot type. 3. The expression used to find the area of a selected region under a function graphed in the work area. 1. The cursor becomes... in the Data & Statistics work area. Using Shade Under Function Use Shade Under Function to calculate the PDF displays when selected.
Select any function graphed in the work area...
Teacher Software Guidebook - Page 680
...
4.
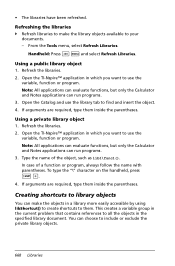
Refreshing the libraries ` Refresh libraries to find and insert the object. 4.
Open the TI-Nspire™ application in which you want to use the library tab to make the objects in the...objects.
668 Libraries Open the Catalog and use the
variable, function or program. Note: All applications can evaluate functions, but only the Calculator and Notes applications can run programs. ...
Teacher Software Guidebook - Page 695

... To use the function or program only from any document and also visible in the program. - From the Actions menu, select Find.
2. If the text is highlighted in the Catalog, select LibPub.
Finding and ...a notification message displays. 3.
If you want to find, and click OK. - To make function or program accessible from the current Calculator problem, select None. -
Programming 683
Teacher Software Guidebook - Page 696

...
- Type the replacement text. 4. All the applications can evaluate functions, but only the Calculator and Notes applications can use it reaches a Return command. • To stop a program or function manually,
- ... to replace the first occurrence after the cursor position,
or click Replace All to find. 3. If the function or program has unstored changes, you can run programs. The...
Teacher Software Guidebook - Page 697

...use the Program Editor to view the object.
If the program requires you to find and insert the object.
-
Open the Catalog and use...public, and non-library objects. Using a Public library function or program 1. libs2\func1...use getVarInfo to view a list of a function or program, always follow the name with parentheses. Using...name given in which you want to use the function or program. In the...
Teacher Software Guidebook - Page 744

x-axis range
y-axis range
Data analysis calculations
Integral Use Integral to select a range.)
Notice that the value and units are shown, and now position and delta values are also shown under the graph. You can find the area under a data plot. The value is displayed in the View Details area and in the All...
Teacher Software Guidebook - Page 745

... to examine all the data, or select a range
to examine.
The values are calculated. To generate statistics: 1. If you want to examine a specific area. Select Analyze > Integral. 3. Statistics Use this option to select a range. 2. To view integral: 1. You can find the statistics for all the data or a selected region of samples are displayed...
Similar Questions

How To Find Ph On A Ti-30x Iis
(Posted by edubhicks 9 years ago)

How Do To Use Calculator For Log Function For Ph And Poh
(Posted by nso4koink81 10 years ago)

How To Find The Z-score When Using A Ti-30xiis Calculator
(Posted by gc525jjduma 10 years ago)

How Do I Use The Calculator To Find Ph, Poh?was Talking To Ron, But Lost Connect
(Posted by sunfish25 12 years ago)