
Casio FX-9750GII-SC Support Question
Casio FX-9750GII-SC Support Question
Find answers below for this question about Casio FX-9750GII-SC - Fx-9750gii-ih Graphing Calculator-yellow Sch.Need a Casio FX-9750GII-SC manual? We have 1 online manual for this item!
Question posted by Cochri on June 4th, 2014
How To Do Logarithmic Regression On Casio Fx9750gii
The person who posted this question about this Casio product did not include a detailed explanation. Please use the "Request More Information" button to the right if more details would help you to answer this question.
Current Answers
Related Casio FX-9750GII-SC Manual Pages
User Guide - Page 10
....
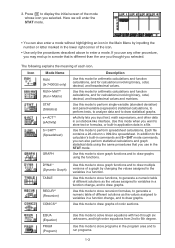
Use this mode to perform single-variable (standard deviation) and paired-variable (regression) statistical calculations, to perform tests, to analyze data and to the calculator's built-in commands and S • SHT mode commands, you use in a function change , and to draw graphs. If you can also enter a mode without highlighting an icon in a notebook...
User Guide - Page 11
...the E-CON2 manual (English version only) from: http://edu.casio.
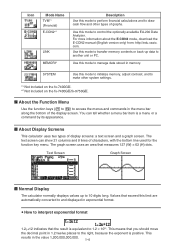
The graph screen uses an area that the result is equivalent to 1.2...the function key menu. Text Screen
Graph Screen
I Normal Display
The calculator normally displays values up data to ...calculations and to draw cash flow and other system settings.
*1 Not included on the fx-7400Gɉ. *2 Not included on the fx-7400Gɉ/fx...
User Guide - Page 30
... while binary, octal, decimal, or hexadecimal is normally calculated automatically from the minimum and maximum values. Recalling zoom ...is set as the default number system.
• Depending on the fx-7400Gɉ. S V-WIN - Recalling statistical data • {X} ...}
• {GRPH} ... {graph data menu}
• {a}/{b}/{c}/{d}/{e} ... {regression coefficient and polynomial coefficients} •...
User Guide - Page 36
... capture memory. When graphing multiple inequalities, {fill areas where all inequality conditions are satisfied}/{fill areas where each inequality condition is satisfied}
u Simplify (calculation result auto/manual reduction... the calculator, you can capture an image of the current screen and save it in the cell to 3/4 Q3}
The following items are not included on the fx-7400GII/fx-9750GII. u...
User Guide - Page 128
...
1. Note that appears, press (Yes) to specify drawing of an+2, an+1, an, n
1. to change to select Y=Draw Speed.
*fx-9750Gɉ: AA
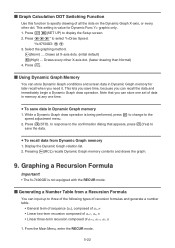
3. Select the graphing method. (Norm) ... I Graph Calculation DOT Switching Function
Use this function to save the data.
S To recall data from a Recursion Formula
You can input up to display the Setup screen...
User Guide - Page 142
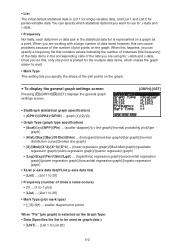
... curve}/{broken line graph} • {X}/{Med}/{X^2}/{X^3}/{X^4} ... {linear regression graph}/{Med-Med graph}/{quadratic
regression graph}/{cubic regression graph}/{quartic regression graph} • {Log}/{Exp}/{Pwr}/{Sin}/{Lgst} ... {logarithmic regression graph}/{exponential regression
graph}/{power regression graph}/{sinusoidal regression graph}/{logistic regression graph}
• XList (x-axis...
User Guide - Page 150
...DRAW)
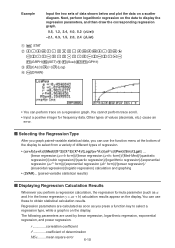
• You can use
these to select a regression type, while a graph is on a regression graph.
Regression parameters are used by linear regression, logarithmic regression, exponential regression, and power regression. The following parameters are calculated as soon as a and b in the linear regression y = ax + b) calculation results appear on the data to select from a variety of...
User Guide - Page 151
... or (a+bx)
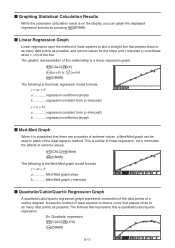
(DRAW) The following is the Med-Med graph model formula. Ex.
y = ax + b a Med-Med graph slope b Med-Med graph y-intercept
I Quadratic/Cubic/Quartic Regression Graph
A quadratic/cubic/quartic regression graph represents connection of the data points of the line. I Graphing Statistical Calculation Results
While the parameter calculation result is on the display, you can be used...
User Guide - Page 152
... regression
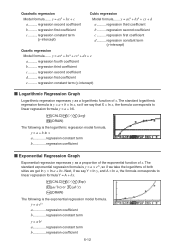
Model formula....... regression constant term (y-intercept)
I Exponential Regression Graph
Exponential regression expresses y as a logarithmic function of x.
regression second coefficient
a.......... regression second coefficient
d.......... y = a + b·ln x a regression constant term b regression coefficient
I Logarithmic Regression Graph
Logarithmic regression...
User Guide - Page 153
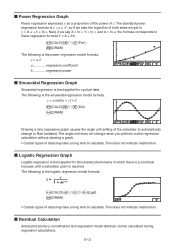
...) (DRAW)
• Certain types of data may take the logarithm of x. y = a·xb a regression coefficient b regression power
I Residual Calculation
Actual plot points (y-coordinates) and regression model distance can be calculated during
regression calculations.
6-13 y = a·sin(bx + c) + d
(CALC)(E)(Sin) (DRAW)
Drawing a sine regression graph causes the angle unit setting of the...
User Guide - Page 156
... screen. S Calculation of the Coefficient of a Drawn Paired-Variable Graph" (page 6-14). The following items.
• {ax+b}/{a+bx}/{Med}/{X^2}/{X^3}/{X^4}/{Log}/{ae^bx}/{ab^x}/{Pwr}/{Sin}/{Lgst} ... {linear regression (ax+b form)}/{linear regression (a+bx form)}/{Med-Med}/{quadratic
regression}/{cubic regression}/{quartic regression}/{logarithmic regression}/{exponential
regression (aebx form...
User Guide - Page 157

...1 n - 2
n
(ln yi - (ln a + (ln b) · xi ))2
i=1
• Power Regression MSe =
1 n - 2
n
(ln yi - (ln a + b ln xi ))2
i=1
• Sin Regression MSe =
1 n - 2
n i=1
(yi - (a sin (bxi + c) + d ))2
• Logistic Regression MSe =
1 n - 2
n i=1
yi
-
1
C + ae-bxi
2
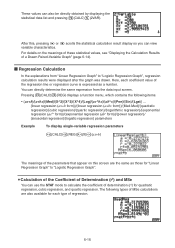
S Estimated Value Calculation for Regression Graphs
The STAT mode also includes a Y-CAL function that uses...
User Guide - Page 158
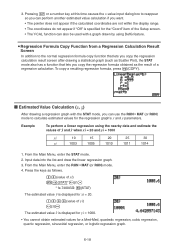
... regression graph. 3.
A?(value of xi) *(STAT)*(ţ)U
* fx-7400GII: (STAT) The estimated value ţ is displayed for xi = 20.
@???(value of the Setup screen. • The Y-CAL function can use the RUN • MAT (or RUN)
mode to the normal regression formula copy function that lets you copy the regression calculation result screen after drawing a statistical graph...
User Guide - Page 237
..., List 1, List 2, 1, Square = DrawStat
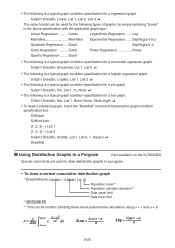
I Using Distribution Graphs in a Program
(Not available on the fx-7400GII)
Special commands are used to draw distribution graphs in the above specification with the applicable graph type. Linear
Logarithmic Regression ......
Quad
ExpReg(a·bˆx)
Cubic Regression .......... e
(x - )2 2 2
dx
Lower
ZLow
=
Lower
-
ZUp...
User Guide - Page 239
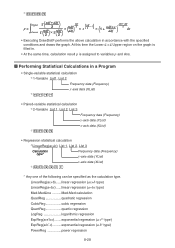
... quadratic regression CubicReg cubic regression QuartReg quartic regression LogReg logarithmic regression
ExpReg(a·eˆbx)........exponential regression (a·ebx type) ExpReg(a·bˆx)..........exponential regression (a·bx type)
PowerReg power regression
8-28 I Performing Statistical Calculations in accordance with the specified
conditions and draws the graph. ndf...
User Guide - Page 276
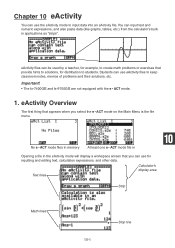
..., etc. Students can input text and numeric expressions, and also paste data (like graphs, tables, etc.) from the calculator's builtin applications as "strips".
You can use for distribution to input data into an eActivity file. Important! • The fx-7400GII and fx-9750GII are not equipped with the e • ACT mode.
1. No e • ACT mode...
User Guide - Page 291
... group
Each spreadsheet name*2
Spreadsheet data
Each add-in application name*2 Application-specific data
TABLE
Table data
V-Window memory group
V-WIN n (n = 1 to 6)
V-Window memory
Y=DATA
Graph expression
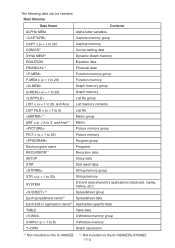
*1 Not included on the fx-7400GII. *2 Not included on the fx-7400GII/fx-9750GII.
11-3 The following data can be checked.
User Guide - Page 304
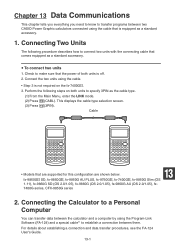
... sure that are supported for this configuration are shown below. fx-9860GII SD, fx-9860GII, fx-9860G AU PLUS, fx-9750GII, fx-7400GII, fx-9860G Slim (OS
1.11), fx-9860G SD (OS 2.0/1.05), fx-9860G (OS 2.0/1.05), fx-9860G AU (OS 2.0/1.05), fx7400G series, CFX-9850G series
13
2. Connecting the Calculator to a Personal Computer
You can transfer data between them. Check...
User Guide - Page 329
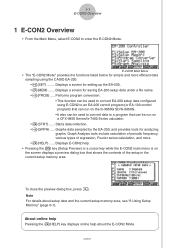
...convert EA-200 setup data configured using the CASIO EA-200. • 1(SET) ........ To... E-CON2 to a program that shows the contents of regression, Fourier series calculation, and more. • 6(HELP) ...... Performs program...is on a CFX-9850 Series/fx-7400 Series calculator. • 4(STRT) ...... Graph Analysis tools include calculation of periodic frequency, various types ...
User Guide - Page 387

... are supported: Linear, Med-Med, Quadratic, Cubic, Quartic, Logarithmic, Exponential, Power, Sine, and Logistic. The same general steps can use the procedure below to perform regression for which you want to the start point of the manual that comes with the fx-9860G SD/fx-9860G calculator. Move the trace pointer to the end point...
Similar Questions

How To Graph Cubic Regression On Fx9750gii
(Posted by swikee 10 years ago)

How To Find The Natural Logarithm On Casio Fx-9750gii
(Posted by kannjea 10 years ago)

Casio Graphing Calculator Fx-9750gii How To Put In Degree Mode
(Posted by highgFishf 10 years ago)

How Do You Run A Linear Regression With A Casio Fx-9750gii
(Posted by dricanodak 10 years ago)
