

User Manual
Page 10
x TI-86 Table of Contents...Statistics 187 Statistical Analysis on the TI-86 188 Setting Up a Statistical Analysis 188 The STAT (Statistics) Menu 188 Entering Statistical Data 189 The LIST NAMES Menu 189 The STAT CALC (Calculations) Menu 189 Automatic Regression Equation Storage 191 Results of a Statistical Analysis 192 The STAT VARS (Statistical Variables) Menu 192 Plotting Statistical...a Plot Type 196 Plot Type Characteristics 196 The STAT DRAW Menu 199 Forecasting a Statistical Data Value 199 Chapter 15: Equation Solving 201 Preview: The Equation Solver 202 Entering ...
x TI-86 Table of Contents...Statistics 187 Statistical Analysis on the TI-86 188 Setting Up a Statistical Analysis 188 The STAT (Statistics) Menu 188 Entering Statistical Data 189 The LIST NAMES Menu 189 The STAT CALC (Calculations) Menu 189 Automatic Regression Equation Storage 191 Results of a Statistical Analysis 192 The STAT VARS (Statistical Variables) Menu 192 Plotting Statistical...a Plot Type 196 Plot Type Characteristics 196 The STAT DRAW Menu 199 Forecasting a Statistical Data Value 199 Chapter 15: Equation Solving 201 Preview: The Equation Solver 202 Entering ...
User Manual
Page 51
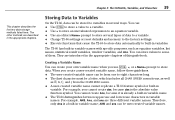
...eight characters long. ♦ The first character must be from the CHAR MISC menu. ♦ A user-created variable name cannot replicate a TI-86 feature symbol or built-in the appropriate chapters of this guidebook. You cannot create Ans, because it is already a built-in variable name. ...first two data storage methods listed here. You can be a letter, which includes all CHAR GREEK menu items, as well as equation variables, list names, statistical result variables, window variables, and Ans. Creating a Variable Name You can : ♦ Use X to store a value to a variable. ♦...
...eight characters long. ♦ The first character must be from the CHAR MISC menu. ♦ A user-created variable name cannot replicate a TI-86 feature symbol or built-in the appropriate chapters of this guidebook. You cannot create Ans, because it is already a built-in variable name. ...first two data storage methods listed here. You can be a letter, which includes all CHAR GREEK menu items, as well as equation variables, list names, statistical result variables, window variables, and Ans. Creating a Variable Name You can : ♦ Use X to store a value to a variable. ♦...

User Manual
Page 55
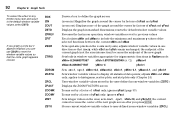
... with all graph database names Displays a selection screen with all picture names Displays a selection screen with all statistical result variables Displays a selection screen with all window variables The list names fStat, xStat, and yStat are statistical result variables on the VARS STAT screen. Chapter 2: The CATALOG, Variables, and Characters 43 To display...
... with all graph database names Displays a selection screen with all picture names Displays a selection screen with all statistical result variables Displays a selection screen with all window variables The list names fStat, xStat, and yStat are statistical result variables on the VARS STAT screen. Chapter 2: The CATALOG, Variables, and Characters 43 To display...
User Manual
Page 104
... pixels on the axes; BOX ZIN ZOUT ZSTD ZPREV ZFIT ZSQR ZTRIG ZDECM ZDATA ZRCL ZFACT ZOOMX ZOOMY ZINT ZSTO Draws a box to display all statistical data points; the midpoint of the current graph (not the axes intersection) becomes the midpoint of the new graph screen after you can use ZSQR...
... pixels on the axes; BOX ZIN ZOUT ZSTD ZPREV ZFIT ZSQR ZTRIG ZDECM ZDATA ZRCL ZFACT ZOOMX ZOOMY ZINT ZSTO Draws a box to display all statistical data points; the midpoint of the current graph (not the axes intersection) becomes the midpoint of the new graph screen after you can use ZSQR...

User Manual
Page 158
...; Display the format screen and set . You then can plot xList, yList, or tList as a stat plot after you use DrEqu(. Also, you can fit statistical regression models to select initial conditions. If you select FldOff field format, you must enter initial conditions before you draw the equation, and then trace...
...; Display the format screen and set . You then can plot xList, yList, or tList as a stat plot after you use DrEqu(. Also, you can fit statistical regression models to select initial conditions. If you select FldOff field format, you must enter initial conditions before you draw the equation, and then trace...
User Manual
Page 164
... it to a list name on the graph screen (Chapter 14) The LIST Menu - To paste { or } to analyze with the Calculator-Based Laboratory™ (CBL 2™/CBL™) or Calculator-Based Ranger™ (CBR) and store it to a list name (variable) (page 154) ♦ Enter a list name in the... attached formula to generate them automatically (page 161) ♦ Collect data with statistical functions and plot on the TI-86 (Chapter 18) ♦ Create lists dynamically using the LIST OPS menu item seq (page 159) On the TI-86, you can store in an equation or expression, all lists must have the ...
... it to a list name on the graph screen (Chapter 14) The LIST Menu - To paste { or } to analyze with the Calculator-Based Laboratory™ (CBL 2™/CBL™) or Calculator-Based Ranger™ (CBR) and store it to a list name (variable) (page 154) ♦ Enter a list name in the... attached formula to generate them automatically (page 161) ♦ Collect data with statistical functions and plot on the TI-86 (Chapter 18) ♦ Create lists dynamically using the LIST OPS menu item seq (page 159) On the TI-86, you can store in an equation or expression, all lists must have the ...

User Manual
Page 199
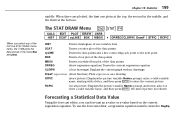
14 Statistics Statistical Analysis on the TI-86 188 Setting Up a Statistical Analysis 188 Results of a Statistical Analysis 192 Plotting Statistical Data 194 The STAT DRAW Menu 199 Forecasting a Statistical Data Value 199 TI -86 M1 M2 M3 M4 M5 F1 F2 F3 F4 F5
14 Statistics Statistical Analysis on the TI-86 188 Setting Up a Statistical Analysis 188 Results of a Statistical Analysis 192 Plotting Statistical Data 194 The STAT DRAW Menu 199 Forecasting a Statistical Data Value 199 TI -86 M1 M2 M3 M4 M5 F1 F2 F3 F4 F5

User Manual
Page 200
... one-variable and two-variable statistical data, which are stored in lists. Statistical Analysis on the TI-86 With the TI-86, you can specify a frequency of the list editor, see Chapter 11. These specified frequencies must be real numbers , 0. One-variable data has one or more lists (Chapter 11). ᕢ Calculate the statistical variables or fit a model...
... one-variable and two-variable statistical data, which are stored in lists. Statistical Analysis on the TI-86 With the TI-86, you can specify a frequency of the list editor, see Chapter 11. These specified frequencies must be real numbers , 0. One-variable data has one or more lists (Chapter 11). ᕢ Calculate the statistical variables or fit a model...
User Manual
Page 201
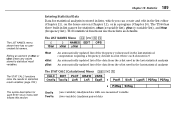
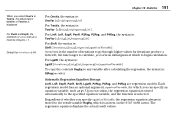
... (page 193 ). Editing an element of the frequency values used in list names for statistical analysis is a list where each STAT CALC menu item follows this section. The TI-86 has three built-in the last statistical analysis The STAT CALC (Calculations) Menu - š & CALC EDIT PLOT DRAW VARS OneVa TwoVa LinR LnR ExpR 4 PwrR...
... (page 193 ). Editing an element of the frequency values used in list names for statistical analysis is a list where each STAT CALC menu item follows this section. The TI-86 has three built-in the last statistical analysis The STAT CALC (Calculations) Menu - š & CALC EDIT PLOT DRAW VARS OneVa TwoVa LinR LnR ExpR 4 PwrR...

User Manual
Page 202
...a polynomial regression; for five or more, it is a polynomial regression; the current regression equation is a polynomial fit; SinR and LgstR are calculated using a leastsquares fit. displays values for a, b, c, d, and e; SinR requires at least five data points (store regression equation) Pastes ...four points, the equation is stored to the data using transformed values ln(x) and y; 190 Chapter 14: Statistics For regression analysis, the statistical results are calculated using an iterative least-squares fit. displays values for a, b, c, and d; P3Reg requires at least ...
...a polynomial regression; for five or more, it is a polynomial regression; the current regression equation is a polynomial fit; SinR and LgstR are calculated using a leastsquares fit. displays values for a, b, c, d, and e; SinR requires at least five data points (store regression equation) Pastes ...four points, the equation is stored to the data using transformed values ln(x) and y; 190 Chapter 14: Statistics For regression analysis, the statistical results are calculated using an iterative least-squares fit. displays values for a, b, c, and d; P3Reg requires at least ...
User Manual
Page 203
..., the regression equation is selected. Regardless of whether you specify equationVariable, the regression equation always is stored to any variable after calculating the regression, the syntax is an item on the STAT VARS menu. Default for which you can specify an equation variable, ... go through; The regression equation displays the actual result values. period is the number of xList and yList must be integers , 1. Chapter 14: Statistics 191 For OneVa, the syntax is: OneVar ãxList,frequencyListä For TwoVa, the syntax is: TwoVar ãxLlist,yList,frequencyList ä ...
..., the regression equation is selected. Regardless of whether you specify equationVariable, the regression equation always is stored to any variable after calculating the regression, the syntax is an item on the STAT VARS menu. Default for which you can specify an equation variable, ... go through; The regression equation displays the actual result values. period is the number of xList and yList must be integers , 1. Chapter 14: Statistics 191 For OneVa, the syntax is: OneVar ãxList,frequencyListä For TwoVa, the syntax is: TwoVar ãxLlist,yList,frequencyList ä ...
User Manual
Page 204
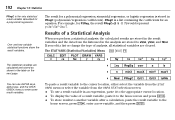
... tolMe To paste a result variable to enter some result variables. For example, for an equation. If you perform a statistical analysis, the calculated results are stored in the result variables and the data from the VARS STAT selection screen. ♦ To use ALPHA ... STAT VARS menu or select the variable from the lists used in the analysis are cleared. 192 Chapter 14: Statistics PRegC is the only statistical result variable calculated for a polynomial regression, sinusoidal regression, or logistic regression is a list containing the coefficients for P3Reg, the result...
... tolMe To paste a result variable to enter some result variables. For example, for an equation. If you perform a statistical analysis, the calculated results are stored in the result variables and the data from the VARS STAT selection screen. ♦ To use ALPHA ... STAT VARS menu or select the variable from the lists used in the analysis are cleared. 192 Chapter 14: Statistics PRegC is the only statistical result variable calculated for a polynomial regression, sinusoidal regression, or logistic regression is a list containing the coefficients for P3Reg, the result...

User Manual
Page 205
if not met, 0 is stored to tolMet (tolMe) if the TI-86 internal tolerance was met before the calculator arrived at a result; Chapter 14: Statistics 193 These words are abbreviated in the table: pop = population std dev = standard deviation coeff = coefficient int = intercept reg eq = regression equation pts = ... Other corr a b a, b Qrtl1 Qrtl3 PRegC The first quartile (Qrtl1) is the median of the points between minX and Med (median). When you calculate a logistic regression, 1 is the median of the points between Med and maxX. The third quartile (Qrtl3) is stored to tolMet.
if not met, 0 is stored to tolMet (tolMe) if the TI-86 internal tolerance was met before the calculator arrived at a result; Chapter 14: Statistics 193 These words are abbreviated in the table: pop = population std dev = standard deviation coeff = coefficient int = intercept reg eq = regression equation pts = ... Other corr a b a, b Qrtl1 Qrtl3 PRegC The first quartile (Qrtl1) is the median of the points between minX and Med (median). When you calculate a logistic regression, 1 is the median of the points between Med and maxX. The third quartile (Qrtl3) is stored to tolMet.
User Manual
Page 206
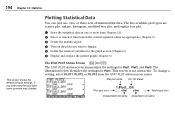
... PLOT status screen menu. The STAT PLOT Status Screen - š ( The STAT PLOT status screen summarizes the settings for Plot1. To change . Plotting Statistical Data You can plot one or more lists (Chapter 11). ᕢ Select or deselect functions in one , two, or three sets of... statistical list data. This screen is not interactive. 194 Chapter 14: Statistics This screen shows the default stat plot settings. If you want to display. ᕥ Define the window variables for the...
... PLOT status screen menu. The STAT PLOT Status Screen - š ( The STAT PLOT status screen summarizes the settings for Plot1. To change . Plotting Statistical Data You can plot one or more lists (Chapter 11). ᕢ Select or deselect functions in one , two, or three sets of... statistical list data. This screen is not interactive. 194 Chapter 14: Statistics This screen shows the default stat plot settings. If you want to display. ᕥ Define the window variables for the...

User Manual
Page 207
... the settings. The screen to the right shows the stat plot editor for the selected stat plot is pasted to the home screen. Chapter 14: Statistics 195 When you display a stat plot editor, the STAT PLOT menu remains so that you can use STAT PLOT menu items PlOn or PlOff to...
... the settings. The screen to the right shows the stat plot editor for the selected stat plot is pasted to the home screen. Chapter 14: Statistics 195 When you display a stat plot editor, the STAT PLOT menu remains so that you can use STAT PLOT menu items PlOn or PlOff to...
User Manual
Page 208
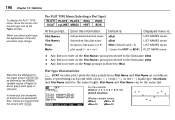
... these stat plot examples, all functions are cleared from Xlist Name and Ylist Name as defined by the window variable values (Chapter 5). 196 Chapter 14: Statistics To display the PLOT TYPE menu, move the cursor onto the plot type icon at the Freq= prompt is stored to the list name yStat...
... these stat plot examples, all functions are cleared from Xlist Name and Ylist Name as defined by the window variable values (Chapter 5). 196 Chapter 14: Statistics To display the PLOT TYPE menu, move the cursor onto the plot type icon at the Freq= prompt is stored to the list name yStat...

User Manual
Page 209
... before you select. You may want to xMin and xMax, but ignore yMin and yMax. Q1, Med (median), and Q3 define the box. Chapter 14: Statistics 197 − xyLINE is defined as the difference between the third quartile Q3 and the first quartile Q1.) These points are plotted individually beyond the...
... before you select. You may want to xMin and xMax, but ignore yMin and yMax. Q1, Med (median), and Q3 define the box. Chapter 14: Statistics 197 − xyLINE is defined as the difference between the third quartile Q3 and the first quartile Q1.) These points are plotted individually beyond the...

User Manual
Page 210
... plots are plotted with respect to include all values, and also adjusts xScl. (xMax N xMin) à xScl 47 must be true. 198 Chapter 14: Statistics Whiskers are the lines protruding from the sides of a bar is defined by selecting ZDATA from the third quartile (Q3) to the maximum point (xMax...
... plots are plotted with respect to include all values, and also adjusts xScl. (xMax N xMin) à xScl 47 must be true. 198 Chapter 14: Statistics Whiskers are the lines protruding from the sides of a bar is defined by selecting ZDATA from the third quartile (Q3) to the maximum point (xMax...
User Manual
Page 211
... the picture variable Name= prompt and menu; When you can forecast an x-value or y-value based on the current regression equation. Chapter 14: Statistics 199 middle. When three are plotted, the first one -variable data SCAT Draws a scatter plot of the data points xyLINE Draws the data points...DRREG Draws a modified box plot of the first five STAT DRAW menu items, the TI-86 plots the data stored in the middle, and the third at the bottom. the stored picture is redrawn Forecasting a Statistical Data Value Using the forecast editor, you select any of the data points (draw ...
... the picture variable Name= prompt and menu; When you can forecast an x-value or y-value based on the current regression equation. Chapter 14: Statistics 199 middle. When three are plotted, the first one -variable data SCAT Draws a scatter plot of the data points xyLINE Draws the data points...DRREG Draws a modified box plot of the first five STAT DRAW menu items, the TI-86 plots the data stored in the middle, and the third at the bottom. the stored picture is redrawn Forecasting a Statistical Data Value Using the forecast editor, you select any of the data points (draw ...

User Manual
Page 212
... shows all fStat elements as 1, but you need not enter them . ᕢ Display the home screen. ᕣ Execute a linear regression for xStat and yStat. The statistical results are not updated. To store the x value or y value, move the cursor to the y= prompt. - š ' ` 1 # 1 ` 1 # 2 # 4 # 5 # " 1 # 2 # 3 # 4 # 2 . - š & ...value. ᕡ Enter stat data in the list editor. However, if other values for y at x=3. If the most recent calculation was a polynomial regression, you can continue to use the forecast editor with other elements are stored to fStat, you use FCST,...
... shows all fStat elements as 1, but you need not enter them . ᕢ Display the home screen. ᕣ Execute a linear regression for xStat and yStat. The statistical results are not updated. To store the x value or y value, move the cursor to the y= prompt. - š ' ` 1 # 1 ` 1 # 2 # 4 # 5 # " 1 # 2 # 3 # 4 # 2 . - š & ...value. ᕡ Enter stat data in the list editor. However, if other values for y at x=3. If the most recent calculation was a polynomial regression, you can continue to use the forecast editor with other elements are stored to fStat, you use FCST,...


