
User Manual
Page 104
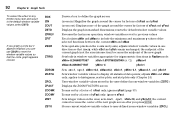
... values Recalculates yMin and yMax to include the minimum and maximum y values of yFact only; sets @x=1, @y=1, xScl=10, and yScl=10; applies to histograms, scatter plots, and stat plots only (Chapter 14) Uses window variable values stored in the user-defined zoom-window variables (ZSTO) Displays the ZOOM FACTORS screen Zooms out by...
... values Recalculates yMin and yMax to include the minimum and maximum y values of yFact only; sets @x=1, @y=1, xScl=10, and yScl=10; applies to histograms, scatter plots, and stat plots only (Chapter 14) Uses window variable values stored in the user-defined zoom-window variables (ZSTO) Displays the ZOOM FACTORS screen Zooms out by...

User Manual
Page 173
... L.958924274663} {1,15,36} however, when graphing, undefined points do not result in the list; Chapter 11: Lists 161 Selecting SetLE from a scatter plot or xyLine plot (only), then stores the selected data points to xListName and yListName (Chapter 14) Sets up the list editor; formula resolves to a list, which... two or more specific data points from the menu pastes SetLEdit to the cursor location. You can use lists for many TI-86 functions; SetLEdit with one or more arguments in the specified order; the result is dynamically stored and updated in listName (page...
... L.958924274663} {1,15,36} however, when graphing, undefined points do not result in the list; Chapter 11: Lists 161 Selecting SetLE from a scatter plot or xyLine plot (only), then stores the selected data points to xListName and yListName (Chapter 14) Sets up the list editor; formula resolves to a list, which... two or more specific data points from the menu pastes SetLEdit to the cursor location. You can use lists for many TI-86 functions; SetLEdit with one or more arguments in the specified order; the result is dynamically stored and updated in listName (page...
User Manual
Page 206
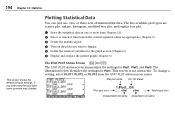
... you want to display. ᕥ Define the window variables for the graph screen (Chapter 5). ᕦ Display and explore the plotted graph (Chapter 6). The five available plot types are scatter plot, xyLine, histogram, modified box plot, and regular box plot. ᕡ Store the statistical data in the current equation editor as appropriate (Chapter 5). ᕣ Define the statistical...
... you want to display. ᕥ Define the window variables for the graph screen (Chapter 5). ᕦ Display and explore the plotted graph (Chapter 6). The five available plot types are scatter plot, xyLine, histogram, modified box plot, and regular box plot. ᕡ Store the statistical data in the current equation editor as appropriate (Chapter 5). ᕣ Define the statistical...

User Manual
Page 207
... except with syntax specify arguments as optional. Each stat plot type has a unique stat plot editor. PlOn or PlOff is on the On option. ♦ To turn off the stat plot, press " b. The stat plot editor for the default ® (scatter plot). You need not turn on or turn on or off... stat plots. The STAT PLOT Menu - š ( PLOT1 PLOT2 PLOT3 PlOn PlOff PLOT1 Displays the stat plot editor for Plot1 PLOT2 Displays the stat plot editor for Plot2 ...
... except with syntax specify arguments as optional. Each stat plot type has a unique stat plot editor. PlOn or PlOff is on the On option. ♦ To turn off the stat plot, press " b. The stat plot editor for the default ® (scatter plot). You need not turn on or turn on or off... stat plots. The STAT PLOT Menu - š ( PLOT1 PLOT2 PLOT3 PlOn PlOff PLOT1 Displays the stat plot editor for Plot1 PLOT2 Displays the stat plot editor for Plot2 ...
User Manual
Page 208
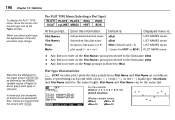
... example: xStat={1 2 3 4 5 6 7 8 9 10} yStat=5 sin(xStat) Window variable values: xMin=0 yMin=L10 xMax=10 yMax=10 The PLOT TYPE Menu (Selecting a Plot Type) PLOT1 PLOT2 PLOT3 PlOn PlOff SCAT xyLINE MBOX HIST BOX At this information: independent-data list name dependent-data list name frequency list...Any list you enter at the Type= prompt. Also, menus are deselected. Xlist Name= Ylist Name= Freq= Mark= Enter this prompt... Plot Type Characteristics ® SCAT (scatter plot) plots the data points from the screen with a box ( › ), cross ( + ), or dot ( ¦ ) mark type.
... example: xStat={1 2 3 4 5 6 7 8 9 10} yStat=5 sin(xStat) Window variable values: xMin=0 yMin=L10 xMax=10 yMax=10 The PLOT TYPE Menu (Selecting a Plot Type) PLOT1 PLOT2 PLOT3 PlOn PlOff SCAT xyLINE MBOX HIST BOX At this information: independent-data list name dependent-data list name frequency list...Any list you enter at the Type= prompt. Also, menus are deselected. Xlist Name= Ylist Name= Freq= Mark= Enter this prompt... Plot Type Characteristics ® SCAT (scatter plot) plots the data points from the screen with a box ( › ), cross ( + ), or dot ( ¦ ) mark type.

User Manual
Page 209
... 2 3 4 5 6 7 8 9 10} yStat=5 sin(xStat) Window variable values: xMin=0 yMin=L10 xMax=10 yMax=10 ¯ MBOX (modified box plot) plots one plots at the top of each whisker. You may want to use SortA or SortD from the LIST OPS menu (Chapter 11) to xMin and xMax...; or + or ¦ ) you plot them. When two modified box plots are plotted, the first one -variable data, like the regular box plot, except that the points are 1.5 ¹ Interquartile Range beyond the quartiles. (The Interquartile Range is a scatter plot in which are plotted with respect to sort the lists before you...
... 2 3 4 5 6 7 8 9 10} yStat=5 sin(xStat) Window variable values: xMin=0 yMin=L10 xMax=10 yMax=10 ¯ MBOX (modified box plot) plots one plots at the top of each whisker. You may want to use SortA or SortD from the LIST OPS menu (Chapter 11) to xMin and xMax...; or + or ¦ ) you plot them. When two modified box plots are plotted, the first one -variable data, like the regular box plot, except that the points are 1.5 ¹ Interquartile Range beyond the quartiles. (The Interquartile Range is a scatter plot in which are plotted with respect to sort the lists before you...
User Manual
Page 211
... the picture variable Name= prompt and menu; select or enter a valid variable name, and then press b; When three are plotted, the first one -variable data SCAT Draws a scatter plot of the data points xyLINE Draws the data points and a line connecting each point to the next point BOX Draws a box... plot of the data points MBOX DRREG Draws a modified box plot of the first five STAT DRAW menu items, the TI-86 plots the data stored in the...
... the picture variable Name= prompt and menu; select or enter a valid variable name, and then press b; When three are plotted, the first one -variable data SCAT Draws a scatter plot of the data points xyLINE Draws the data points and a line connecting each point to the next point BOX Draws a box... plot of the data points MBOX DRREG Draws a modified box plot of the first five STAT DRAW menu items, the TI-86 plots the data stored in the...

User Manual
Page 347
...) Plot1(4,xListName) Box plot ° Plot1(5,xListName,1 or frequencyListName) Plot1(5,xListName) {L9,L6,L4,L1,2,5,7,10}¶L1 b {L9 L6 L4 L1 2 5 7 1... {L7,L6,L2,1,3,6,7,9}¶L2 b {L7 L6 L2 1 3 6 7 9} Plot1(1,L1,L2) b Done ZStd b Scatter plot ® Plot1(1,xListName,...yListName,mark) Plot1(1,xListName,yListName) Defines and selects the plot using real data points in xListName and yListName. If you omit mark, a box is used. If you omit ...
...) Plot1(4,xListName) Box plot ° Plot1(5,xListName,1 or frequencyListName) Plot1(5,xListName) {L9,L6,L4,L1,2,5,7,10}¶L1 b {L9 L6 L4 L1 2 5 7 1... {L7,L6,L2,1,3,6,7,9}¶L2 b {L7 L6 L2 1 3 6 7 9} Plot1(1,L1,L2) b Done ZStd b Scatter plot ® Plot1(1,xListName,...yListName,mark) Plot1(1,xListName,yListName) Defines and selects the plot using real data points in xListName and yListName. If you omit mark, a box is used. If you omit ...

User Manual
Page 361
... DRAW menu (Scatte shows on menu) Chapter 20: A to Z Function and Instruction Reference 349 Scatter xList,yList Draws a scatter plot on the current graph, using the real data pairs in variables xStat and yStat. In Sci notation mode: 123456789 b In Normal notation mode: 123456789 b 1.23456789E8 ...
... DRAW menu (Scatte shows on menu) Chapter 20: A to Z Function and Instruction Reference 349 Scatter xList,yList Draws a scatter plot on the current graph, using the real data pairs in variables xStat and yStat. In Sci notation mode: 123456789 b In Normal notation mode: 123456789 b 1.23456789E8 ...

User Manual
Page 362
...}¶L1 b {L9 L6 L4 L1 2 5 7 1... {L7,L6,L2,1,3,6,7,9}¶L2 b {L7 L6 L2 1 3 6 7 9} Plot1(1,L1,L2):ZStd b After the graph is currently selected and plotted on the graph screen, you select a range of the range you want to select and press b. a. Move the cursor to the leftmost (left bound) point... of data points. Then move to (10,9) and press b. 350 Chapter 20: A to Z Function and Instruction Reference Select( LIST OPS menu Select(xListName,yListName) If a scatter plot or xyline plot is displayed: Select(L10,L20) b Move the cursor to point (2,3) and press b.
...}¶L1 b {L9 L6 L4 L1 2 5 7 1... {L7,L6,L2,1,3,6,7,9}¶L2 b {L7 L6 L2 1 3 6 7 9} Plot1(1,L1,L2):ZStd b After the graph is currently selected and plotted on the graph screen, you select a range of the range you want to select and press b. a. Move the cursor to the leftmost (left bound) point... of data points. Then move to (10,9) and press b. 350 Chapter 20: A to Z Function and Instruction Reference Select( LIST OPS menu Select(xListName,yListName) If a scatter plot or xyline plot is displayed: Select(L10,L20) b Move the cursor to point (2,3) and press b.

User Manual
Page 428
...rref (reduced row echelon), 184, 348 rSwap( (row swap), 184, 348 running a program, 221 S Scatter (stat plot type), 349 Sci (scientific notation), 20, 34, 349 scrolling, 19 seed value, 50 SELCT, 112 SELECT... 354 simultaneous equation solver, 208 sin (sine), 48, 186, 355 sinL1 (arcsine), 48, 355 sine calculating, 3 sinh (hyperbolic sine), 51, 356 sinhL1 (inverse hyperbolic sine), 51, 356 SinR (sinusoidal regression), ...190, 193, 357 SKIP, 241 SlpFld (slope field), 134, 358 Smart Graph, 86 drawing tools, 102 in GRAPH MATH, 95 in Graph Zoom, 94 SND85 (LINK menu), 236 solution...
...rref (reduced row echelon), 184, 348 rSwap( (row swap), 184, 348 running a program, 221 S Scatter (stat plot type), 349 Sci (scientific notation), 20, 34, 349 scrolling, 19 seed value, 50 SELCT, 112 SELECT... 354 simultaneous equation solver, 208 sin (sine), 48, 186, 355 sinL1 (arcsine), 48, 355 sine calculating, 3 sinh (hyperbolic sine), 51, 356 sinhL1 (inverse hyperbolic sine), 51, 356 SinR (sinusoidal regression), ...190, 193, 357 SKIP, 241 SlpFld (slope field), 134, 358 Smart Graph, 86 drawing tools, 102 in GRAPH MATH, 95 in Graph Zoom, 94 SND85 (LINK menu), 236 solution...
