
Casio FX-CG10 Support Question
Casio FX-CG10 Support Question
Find answers below for this question about Casio FX-CG10.Need a Casio FX-CG10 manual? We have 2 online manuals for this item!
Question posted by fpmendanfa on June 28th, 2014
How To Use Casio Fx-cg10 To Graph Circle
The person who posted this question about this Casio product did not include a detailed explanation. Please use the "Request More Information" button to the right if more details would help you to answer this question.
Current Answers
Related Casio FX-CG10 Manual Pages
Software User Guide - Page 4
...Calculations ...7-17 11. Command Reference 8-11 6. eActivity Function Menus 10-2 3. Chapter 6 Statistical Graphs and Calculations
1. Confidence Interval ...6-46 7. Basic Programming Steps 8-1 2. CASIO Scientific Function Calculator...Margin 7-13 8. Calculating and Graphing Single-Variable Statistical Data 6-8 3. Spreadsheet Basics and the Function Menu 9-1 2. Using the Memory Manager...
Software User Guide - Page 10
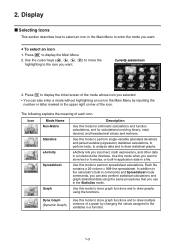
... . 2.
Press m to store text or formulas, or built-in application data in the Statistics mode. Statistics
Use this mode to the calculator's built-in commands and Spreadsheet mode commands, you can also perform statistical calculations and graph statistical data using the functions. Each file contains a 26-column × 999-line spreadsheet.
In addition to perform...
Software User Guide - Page 11
... the program area and to run programs.
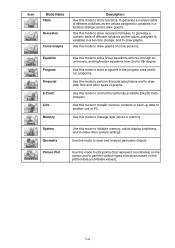
Use this mode to perform financial calculations and to draw cash flow and other system settings. Use this mode to transfer memory contents or back-up data to draw graphs of conic sections. Use this mode to another unit or PC.
Use this mode to control the optionally available...
Software User Guide - Page 45

... saved from the graph screen of any mode (Statistics, Spreadsheet, Financial, etc.)
1-38 u Reset
Use reset when you will not be able to turn power back on, and there is the danger that memory contents will be corrupted or lost entirely. • You will not be compatible with the fx-CG10. • "To capture...
Software User Guide - Page 46

... contain inserted images that were stored (or updated) on the fx-CG20 cannot be opened with the fx-CG10.
• If the message "Provided by CASIO" appears at the bottom of the detail screen of an image file or eActivity file that was displayed using the operation under "Viewing Detailed Information about a File in Storage...
Software User Guide - Page 187
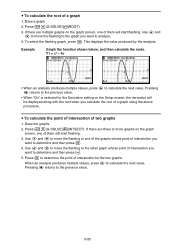
...4. Press !5(G-SOLVE)1(ROOT). 3. This displays the value produced by the analysis. Pressing d returns to calculate the next value. Example
Graph the function shown below, and then calculate the roots. Draw the graphs. 2. Pressing d returns to the other graph whose point of a graph using the above procedure. When an analysis produces multiple values, press e to the previous value...
Software User Guide - Page 194
... Graph Parameters
You can also use the List Editor screen to produce a graph and check for tendencies.
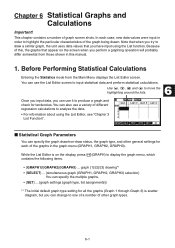
Chapter 6 Statistical Graphs and Calculations
Important! Because of the graphs in the graph menu (GRAPH1, GRAPH2, GRAPH3). You can specify the graph draw/non-draw status, the graph type, and other graph types.
6-1
graph {1}/{2}/{3} drawing*1 • {SELECT} ... {simultaneous graph...
Software User Guide - Page 209
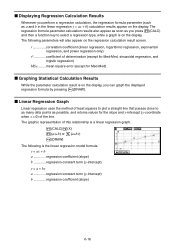
...) y = a + bx a regression constant term (y-intercept) b regression coefficient (slope)
6-16 mean square error (except for Med-Med)
k Graphing Statistical Calculation Results
While the parameter calculation result is on the display.
k Linear Regression Graph
Linear regression uses the method of least squares to plot a straight line that passes close to select a regression type, while...
Software User Guide - Page 268

... Screen) S =
1 .........Payment : Begin (Setup Screen)
PMT
=
- Use the following standard formulas to calculate compound interest. Compound Interest
This calculator uses the following function menus to maneuver between calculation result screens. • {REPEAT} ... {parameter input screen} • {GRAPH} ... {draws graph}
After drawing a graph, you can press !1(TRACE) to the parameter...
Software User Guide - Page 281

...-of-the-years'-digits method} • {DB} ... {Calculate depreciation for year j calculated using the declining-balance method}
Calculation Result Output Examples
{SYD}
{SYD} − {TABLE}
{SYD} − {GRAPH}
An error occurs if parameters are not configured correctly. Before starting bond calculations, use one of a bond. settings (page 7-2). Use the following function menu to maneuver...
Software User Guide - Page 307

If there is a calculation input, that calculation result is displayed.
• The line is designated by a value from 1 to 7, while the column is designated by a value from 1 to 21.
(1, 1) →
← (21, 1)
(1, 7) →
← (21, 7)
Example: Cls_ Blue Locate 7, 1, "CASIO FX"
This program displays the text "CASIO FX" in blue, in the center of the screen.
•...
Software User Guide - Page 316

...
*1 Input this Y1 with the calculator keys. A Syntax ERROR will occur if you need to overlay graphs on top of each other graphing functions
• V-Window
View Window , , , , , , , ,
StoV-Win The following shows various types of syntax you input "Y" with J4(GRAPH)1(Y)b (displayed as ). k Using Graph Functions in a Program
You can incorporate graph functions into a program to...
Software User Guide - Page 322

... be omitted. At this time the Lower < x < Upper region on the
graph is filled in accordance with the specified
conditions and draws the graph. k Using Distribution Graphs in a Program
Special commands are used to draw distribution graphs in .
• At the same time, the p calculation result value and the Lower and Upper input values are assigned respectively...
Software User Guide - Page 378
... spreadsheet.
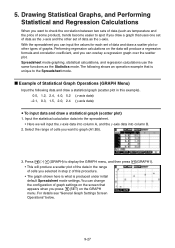
• Here we will produce a scatter plot of the data in step 2 of graphs. Spreadsheet mode graphing, statistical calculations, and regression calculations use the same functions as temperature and the price of data as the y-axis. k Example of Statistical Graph Operations (GRAPH Menu)
Input the following shows an operation example that appears when you can input...
Software User Guide - Page 388

... inputting and editing text, calculation expressions, and other data. Chapter 10 eActivity
You can use for distribution to input data into an eActivity file.
Scroll bar
Text lines
Calculator's Strip display area
10
... and pictures, and also paste data (like graphs, tables, etc.) from the calculator's built-in the eActivity mode will display a workspace screen that appears when you can...
Software User Guide - Page 409

...fx-CG10/fx-CG20" means, for example, colored text data, memo data appended to the following operations on the workspace screen. Input up to 8 characters for new features added by any CASIO calculator ...file name you save an eActivity file using the fx-CG10/fx-CG20 to the file name. • Saving a newly created file • Saving an existing file using the "save as" operation (1(FILE)2(SAVE...
Software User Guide - Page 444
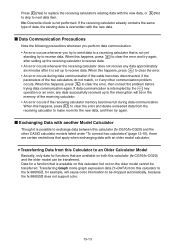
... calculator that is available on this Calculator to receive data. If data communication is possible to receive data.
Transferring Graph mode graph expression data (Y=DATA) from this calculator (fx-CG10/fx-... calculator to receive data. • An error occurs whenever the receiving calculator does not receive any other CASIO calculator models listed under "To connect two calculators"...
Software User Guide - Page 446
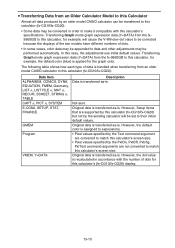
... command arguments are supported by this calculator (fx-CG10/fx-CG20) but not by an older model CASIO calculator can be transferred to this calculator (fx-CG10/fx-CG20).
• Some data may be performed automatically. However, the default color is . Original data is transferred as -is .
Transferring Graph mode graph expression data (Y=DATA) from the fx-
9860GII to make it compatible...
Software User Guide - Page 516

...use CASIO original contents you download from http://edu.casio.com.
u To open , and then press 1(OPEN) or w. From the Main Menu, enter the Picture Plot mode. • This displays the file list screen. • If the file you opened the last time you used...screen is already built into the calculator, or you can be opened automatically whenever you want to use of a background image file. ...
Hardware Guide - Page 2
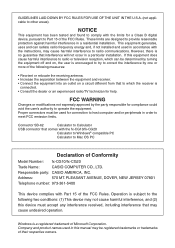
... meet FCC emission limits. GUIDELINES LAID DOWN BY FCC RULES FOR USE OF THE UNIT IN THE U.S.A. (not applicable to the following ...fx-CG10/fx-CG20
Calculator to Windows® compatible PC
Calculator to Mac OS PC
Declaration of the FCC Rules.
Connector SB-62
Calculator to Calculator
USB connector that comes with Part 15 of Conformity
Model Number: Trade Name:
fx-CG10/fx-CG20 CASIO...
Similar Questions

Casio Fx-cg10 Stuck In Update Screen
i have a casio fx-cg10 that is stuck in the update screen. It happened when i change the batteries i...
i have a casio fx-cg10 that is stuck in the update screen. It happened when i change the batteries i...
(Posted by CSR252 7 years ago)


How Do I Find The Y Value On The X Axis When Using A Casio Graphing Fx-9750gii
calculator
calculator
(Posted by dwillphc 10 years ago)
Casio Fx-cg10 Graphing Calculator How To Graph An Absolute Value Function
(Posted by ADEzophar 10 years ago)

How To Solve Cubic Equation Using Fx-991 Ms Calculator? Pl. Help
(Posted by nvram2001 12 years ago)