Casio FX9750GII Support Question
Casio FX9750GII Support Question
Find answers below for this question about Casio FX9750GII - 0CALCULATOR GRAPHIC.Need a Casio FX9750GII manual? We have 1 online manual for this item!
Question posted by canb1234 on July 11th, 2014
How To Program My Casio Fx-9750gii To Graph Change X To Y
The person who posted this question about this Casio product did not include a detailed explanation. Please use the "Request More Information" button to the right if more details would help you to answer this question.
Current Answers
Related Casio FX9750GII Manual Pages
User Guide - Page 4
... ...7-14 11. eActivity Function Menus 10-2 3. Using the Memory Manager 11-1
iii Chapter 6 Statistical Graphs and Calculations
1. Day/Date Calculations 7-11 9. Depreciation ...7-12 10. Basic Programming Steps 8-1 2. Command Reference ...8-7 6. Basic Spreadsheet Operations 9-2 3. S • SHT Mode Memory 9-20
Chapter 10 eActivity
1. eActivity File Operations...
User Guide - Page 11
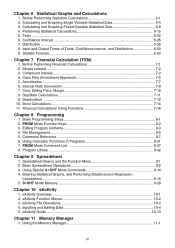
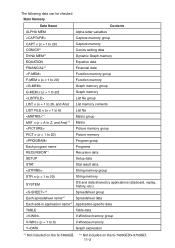
... the E-CON2 manual (English version only) from: http://edu.casio. Use this mode to transfer memory contents or back-up to...graphs. Use this mode to draw cash flow and other system settings.
*1 Not included on the fx-7400Gɉ. *2 Not included on the fx-7400Gɉ/fx-9750Gɉ. Icon
Mode Name TVM*1 (Financial) E-CON2*1
LINK
MEMORY
Description
Use this mode to perform financial calculations...
User Guide - Page 38

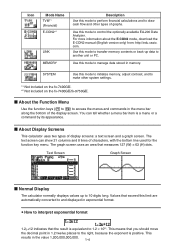
... initial defaults.
Normally, pressing the RESTART button reboots the calculator's operating system, so programs, graph functions and other data, any data that memory contents will be corrupted or lost .
RESTART button
P button
fx-9860G SD fx-9860G fx-9860G AU PLUS
fx-9750G fx-7400G
fx-9860G SD fx-9860G
fx-9860G Slim
Important!
This means that if you press the...
User Guide - Page 72
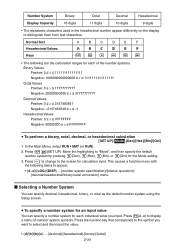
...operation}/ {decimal/hexadecimal/binary/octal conversion} menu
I Selecting a Number System
You can specify a number system for calculation input.
In the Main Menu, select RUN • MAT (or RUN).
2. Press (d~o) to distinguish them ...using the Setup screen. Press ) to change to select and then input the value.
• {d}/{h}/{b}/{o} ... {decimal}/{hexadecimal}/{binary}/{octal} 2-34
User Guide - Page 137
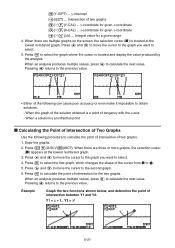
When there are three or more graphs, the selection cursor
(I to select the first graph, which changes the shape of two graphs.
1. When an analysis produces multiple values, press C to select the graph where the cursor is located at the lowest numbered graph. 3. When a solution is a point of the following procedure to calculate the point of intersection of...
User Guide - Page 146
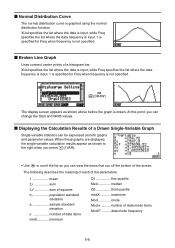
... view the items that run off the bottom of the screen. When these graphs are displayed, the single-variable calculation results appear as shown to the right when you press (1VAR).
• Use A to scroll the list so you can change the Start and Width values. At this point, you can be expressed...
User Guide - Page 154
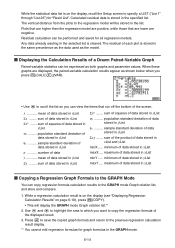
... a LIST ("List 1" through "List 26") for "Resid List". minimum of the displayed result.
3. While a regression calculation result is stored in the GRAPH mode.
6-14 Residual calculation can view the items that are lower are displayed, the paired-variable calculation results appear as shown below when you press (CALC)(2VAR).
• Use A to copy the...
User Guide - Page 156
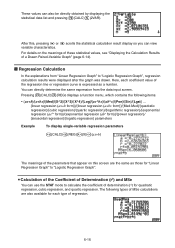
... display so you can directly determine the same expression from "Linear Regression Graph" to "Logistic Regression Graph", regression calculation results were displayed after the graph was drawn. You can view variable characteristics. S Calculation of the Coefficient of Determination (r2) and MSe
You can also be directly obtained by displaying the statistical data list and pressing...
User Guide - Page 228
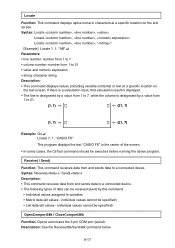
...; Matrix data (all values - If there is a calculation input, that calculation result is displayed.
• The line is designated by a value from 1 to 7, while the column is designated by a value from and sends data to 21.
(1, 1)
(21, 1)
(1, 7)
(21, 7)
Example: Cls= Locate 7, 1, "CASIO FX" This program displays the text "CASIO FX" in the center of data can be...
User Guide - Page 233
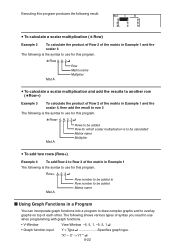
...+ A, 2, 3= Mat A
Row number to be added to Row number to be calculated Matrix name Multiplier
S To add two rows (Row+)
Example 4 To add Row 2 to Row 3 of the matrix in a Program
You can incorporate graph functions into a program to draw complex graphs and to overlay graphs on top of each other.
"X2 - 3" m Y1*1= 8-22
The following...
User Guide - Page 235

...-Plt=
1 m an Start= 3 m bn Start=
• Statistical convergence/divergence graph (WEB graph)
DrawWeb an+1, 10=
I Using Table & Graph Functions in a Program
Table & Graph functions in a program can be specified)
*
8-24
• Dynamic Graph range 1 m D Start= 5 m D End= 1 m D pitch=
I Using List Sort Functions in a Program
These functions let you sort data in lists into...
User Guide - Page 269
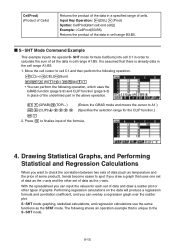
...: CellProd(start cell:end cell[)] Example: =CellProd(B3:B5) Returns the product of the data in a specified range of cells. S • SHT mode graphing, statistical calculations, and regression calculations use the same functions as the y-axis. CellProd( (Product of Cells)
Returns the product of the data in cell range B3:B5. Press U to...
User Guide - Page 270
...range of cells you selected in this example).
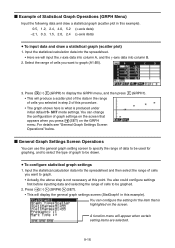
0.5, 1.2, 2.4, 4.0, 5.2 (x-axis data) -2.1, 0.3, 1.5, 2.0, 2.4 (y-axis data)
S To input data and draw a statistical graph (scatter plot)
1. Input the statistical calculation data into column B.
2. Input the statistical calculation data into the spreadsheet.
• Here we will produce a scatter plot of the data in this example).
For details...
User Guide - Page 301
... group
Each spreadsheet name*2
Spreadsheet data
Each add-in application name*2 Application-specific data
TABLE
Table data
V-Window memory group
V-WIN n (n = 1 to 6)
V-Window memory
Y=DATA
Graph expression
*1 Not included on the fx-7400GII. *2 Not included on the fx-7400GII/fx-9750GII.
11-3 The following data can be checked.
User Guide - Page 305
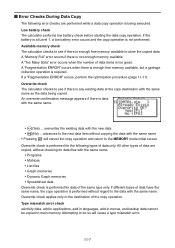
...without copying the data with the same name. • Programs • Matrices • List files • Graph memories • Dynamic Graph memories • Spreadsheet data Overwrite check is performed without... copy destination with the same name.
• (Yes) ... Overwrite check The calculator checks to store the copied data. An overwrite confirmation message appears if there is enough...
User Guide - Page 314
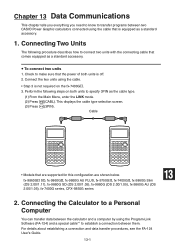
.... 2. This displays the cable type selection screen. (3) Press (3PIN). Connecting the Calculator to a Personal Computer
You can transfer data between the calculator and a computer by using the Program-Link Software (FA-124) and a special cable*1 to establish a connection between two CASIO Power Graphic calculators connected using the cable.
• Step 3 is not required on both units...
User Guide - Page 315
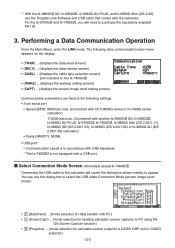
... bps max. (Connected with CFX-9850G series or fx-7400G series calculator)
115200 bps max. (Connected with another fx-9860GII SD, fx-9860GII, fx-9860G AU PLUS, fx-9750GII, fx-7400GII, fx-9860G Slim (OS 2.00/1.11),
fx-9860G SD (OS 2.00/1.05), fx-9860G (OS 2.00/1.05) or fx-9860G AU (OS 2.00/1.05) calculator) • Parity (PARITY): NONE • USB port...
User Guide - Page 333
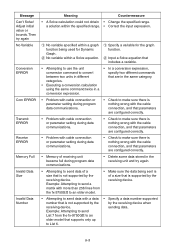
... Number
Meaning
Countermeasure
• A Solve calculation could not obtain • Change the specified range. Example: Attempting to send a
matrix with more than 256 lines from the fx-9750GII to an
older model that supports only up to send data of a
• Make sure the data being used for Dynamic Graph.
No variable within a Solve equation...
User Guide - Page 378
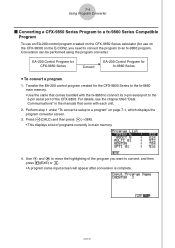
... displays a list of the program you need to convert the program to an fx-9860 program. Transfer the EA-200 control program created for fx-9860 Series
u To convert a program
1.
7-4 Using Program Converter
k Converting a CFX-9850 Series Program to a fx-9860 Series Compatible Program
To use an EA-200 control program created on the CFX-9850 Series calculator (for use on the CFX...
User Guide - Page 396

... then press w. • This displays a dialog box for specifying the start degree of the Fourier series expansion may not align correctly with the calculation result.
7. Pressing 6(DRAW) here graphs the function.
• This lets you press 6(DRAW) in the range of the Fourier series.
6. Move the trace pointer to align it is...
Similar Questions

How To Graph A Linear Equation On My Casio Fx9750gii
(Posted by kenbc 9 years ago)

How To Put Snake On A Graphics Calculator Casio Fx-9750gii
(Posted by mfumatil 9 years ago)


How To Change Program Passwords On A Fx-9750gii
(Posted by yousajack 9 years ago)
