Casio FX9750GII Support Question
Casio FX9750GII Support Question
Find answers below for this question about Casio FX9750GII - 0CALCULATOR GRAPHIC.Need a Casio FX9750GII manual? We have 1 online manual for this item!
Question posted by hanyfmankarios on August 13th, 2010
Graph35+
What are the differences between FX 9750 GII and GRAPH 35+ ?
Current Answers
Related Casio FX9750GII Manual Pages
User Guide - Page 42
... common multiple of c and f.
Example: log3 + 2 = 1.891334817
2-4
Example:
'3 11
+
'2 10
=
10'3 + 11'2 110
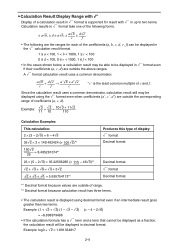
Calculation Examples This calculation: 2 s (3 - 25) = 6 - 45 352 s 3 = 148.492424 (= 1052)*1 150'2 = 8.485281374*1 25 23 s (5 - 23) = 35.32566285 (= 115 - 463)*1 2 + 3 + 8 = 3 + 32 '2 + '3 + '6 = 5.595754113*2
Produces this type of display: format Decimal format...
User Guide - Page 47
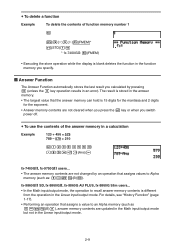
...To delete the contents of the answer memory in a calculation
Example
123 + 456 = 579 789 - 579 = 210
@AB
CDEU FGH (Ans)U
fx-7400GII, fx-9750GII users...
• The answer memory contents are not ...value to recall answer memory contents is different from the operation in the Linear input/output mode.
2-9
fx-9860GII SD, fx-9860GII, fx-9860G AU PLUS, fx-9860G Slim users...
• In ...
User Guide - Page 56
...14
20.7U)
Calculate x and y when r = 25 and Ƨ = 56°
1 1 3.979 13.97982259 (x) 2 20.725 20.72593931 (y)
(Rec() 25
56U
* fx-7400GII, fx-9750GII: AAAAA ** fx-7400GII: (...ANGL)
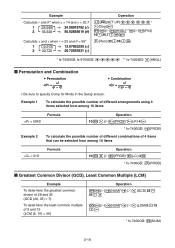
I Greatest Common Divisor (GCD), Least Common Multiple (LCM)
Example
To determine the greatest common divisor of 28 and 35 (GCD (28, 35) = 7)
To...
User Guide - Page 136
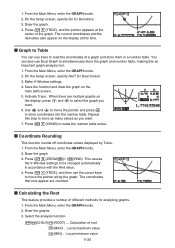
... use Dual Graph to simultaneously store the graph and number table, making this step to store coordinates into the number table. Draw the graphs. 3. On the Setup screen, specify GtoT for Derivative. 3. I Coordinate Rounding
This function rounds off coordinate values displayed by Trace. 1.
Calculation of different methods for analyzing graphs. 1. Draw the graph. 4. Make V-Window...
User Guide - Page 137
... cursor to the previous value. Draw the graphs. 2. Press U to select the first graph, which changes the shape of two graphs.
1.
Pressing B returns to the second graph. 6.
y-coordinate for a given range
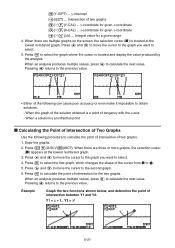
4. Press D and A to move the cursor to the graph you want to calculate the point of Two Graphs
Use the following can cause poor accuracy or...
User Guide - Page 138
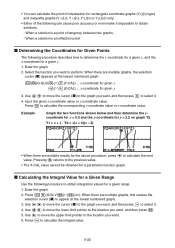
.... 1. Use DA to move the cursor (I Determining the Coordinates for Given Points
The following can calculate the point of intersection for rectangular coordinate graphs (Y=f(x) type) and inequality graphs (Y
f(x), Y
f(x), Y Pf(x) or Y Of(x)) only.
• Either of tangency between two graphs
- Pressing B returns to the previous value.
• The X-CAL value cannot be obtained for given...
User Guide - Page 140
...]
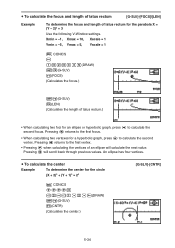
Example
To determine the focus and length of latus rectum for an ellipse or hyperbolic graph, press C to calculate the second focus. Xmin = -1, Xmax = 10, Xscale = 1 Ymin = -5, Ymax = 5, Yscale = 1
K CONICS U @UAUBU(DRAW) (G-SLV) (FOCS) (Calculates the focus.)
(G-SLV) (LEN) (Calculates the length of an ellipse will scroll back through previous values. Pressing B returns to...
User Guide - Page 141
...in this manual.
1.
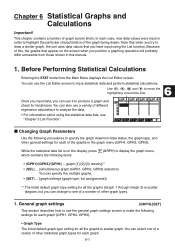
This chapter contains a number of different regression calculations to input statistical data and perform statistical calculations. Note that appear on the display, press (GRPH) to display the graph menu, which contains the following procedures to specify the graph draw/non-draw status, the graph type, and other graph types.
1. Use D, A, B and C to move the...
User Guide - Page 151
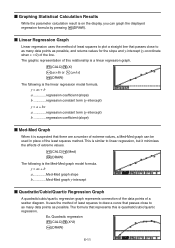
I Graphing Statistical Calculation Results
While the parameter calculation result is on the display, you can be ... The graphic representation of a scatter diagram. y = ax + b a Med-Med graph slope b Med-Med graph y-intercept
I Quadratic/Cubic/Quartic Regression Graph
A quadratic/cubic/quartic regression graph represents connection of the data points of this is the Med-Med graph model formula...
User Guide - Page 197

... only.
• Whenever performing an actual financial transaction, be used to display the following formulas to check any calculation results obtained using this mode should be regarded as shown below.
• Pressing (TRCE) while a graph is on the display activates Trace, which can use a positive or a negative value for the present value...
User Guide - Page 227
... 68 58 48
38
27
77 67 57 47
37
76 66 56 46 36 26
75 65 55 45 35 25
74 64 54 44
73 63 53 43 33
72 62 52 42 32
71 61 51 41 31...,
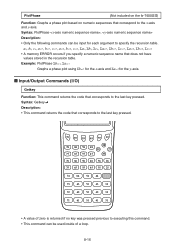
Description: • Only the following commands can be input for the y-axis. PlotPhase
(Not included on the fx-7400GII)
Function: Graphs a phase plot based on numeric sequences that correspond to executing this command. • This command can be used ...
User Guide - Page 314
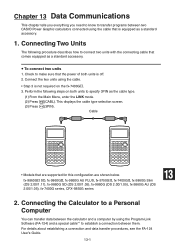
... units to establish a connection between two CASIO Power Graphic calculators connected using the cable.
• Step 3 is off. 2. fx-9860GII SD, fx-9860GII, fx-9860G AU PLUS, fx-9750GII, fx-7400GII, fx-9860G Slim
(OS 2.00/1.11), fx-9860G SD (OS 2.00/1.05), fx-9860G (OS 2.00/1.05), fx-9860G AU (OS 2.00/1.05), fx-7400G series, CFX-9850G series
13
2. Cable
•...
User Guide - Page 320
... sent.
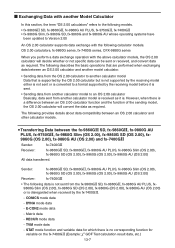
• Sending data from another calculator model to an OS 2.00 calculator Basically, data sent from another Model Calculator
In this section, the term "OS 2.00 calculators" refers to the following models.
• fx-9860GII SD, fx-9860GII, fx-9860G AU PLUS, fx-9750GII, fx-7400GII
• fx-9860G Slim, fx-9860G SD, fx-9860G and fx-9860G AU whose operating systems have...
User Guide - Page 322
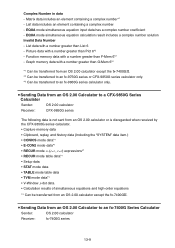
... - Function memory data with a number greater than F-Mem 6*2 - Graph memory data with a number greater than G-Mem 6*2
*1 Can be transferred to an fx-7400G Series Calculator
Sender:
OS 2.00 calculator
Receiver:
fx-7400G series
13-9 S Sending Data from an OS 2.00 Calculator to a CFX-9850G Series Calculator
Sender:
OS 2.00 calculator
Receiver:
CFX-9850G series
The following data is...
User Guide - Page 323
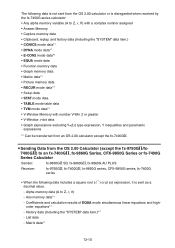
... • EQUA mode data • Function memory data • Graph memory data • Matrix data*1 • Picture memory data &#...Calculator (except the fx-9750Gɉ/fx7400Gɉ) to an fx-7400Gɉ, fx-9860G Series, CFX-9850G Series or fx-7400G
Series Calculator
Sender:
fx-9860GII SD, fx-9860GII, fx-9860G AU PLUS
Receiver:
fx-9750GII, fx-7400GII, fx-9860G series, CFX-9850G series, fx...
User Guide - Page 324
...
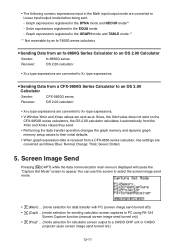
Pressing (CAPT) while the data communication main menu is . Graph expressions registered in the Math input/output mode are sent as follows: Blue: Normal; • The following numeric expressions input in the GRAPH mode and TABLE mode *1
*1 Not receivable by an fx-7400G series calculator. Since, the Xdot value does not exist on )}
13...
User Guide - Page 333
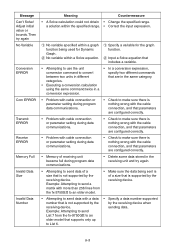
...more than 256 lines from the fx-9750GII to List 6.
• ...graph function being used for Dynamic Graph.
No variable within a Solve equation.
Specify a variable for the graph function.
Input a Solve equation that includes a variable.
• Attempting to use the unit conversion command to convert between two units in different categories.
• Executing a conversion calculation...
User Guide - Page 339
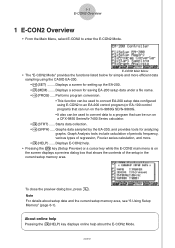
... on a CFX-9850 Series/fx-7400 Series calculator. • 4(STRT) ...... Performs program conversion. • This function can be run on the fx-9860G SD/fx-9860G. • It also... for saving EA-200 setup data under a file name. • 3(PROG) ..... Displays a screen for analyzing graphs. Starts data collection. • 5(GRPH) ..... Displays a screen for simple and more . • 6(HELP)...
User Guide - Page 391

... to Transform a Waveform to determine the tendency of a graph. Starts an operation for zooming and editing a particular graph when the graph screen contains multiple graphs. Note • The cursor keys perform different operations besides scrolling while a trace or graph
operation is on page 11-9. See "Working with Multiple Graphs" on page 11-12.
See "Outputting a Specific Range...
User Guide - Page 399

... were originally on a graph that overlaying a Y=f(x) graph on a sampled data graph does not automatically draw a regression graph based on a multi-graph display
1. After the graph function list settings are multiple graphs on the graph screen.
/
Original Graph
Overlaid with Multiple Graphs
The procedures in step 4 above is turned on, over the graph that was calculated and stored by...
Similar Questions

Fixing Dropped Calculator.. Casio Fx-991es
How to fix dropped calculator (casio fx-991ES) it is not working.
How to fix dropped calculator (casio fx-991ES) it is not working.
(Posted by melmoomine 9 years ago)

How To Put Snake On A Graphics Calculator Casio Fx-9750gii
(Posted by mfumatil 9 years ago)


How To Find Ratio On Calculator Casio Fx-9750gii
(Posted by Verharl 10 years ago)
How To Calculate Standard Deviation On Casio Fx-9750gii
(Posted by generst 10 years ago)