ISS Technology Update, Volume 8, Number 2
Page 3
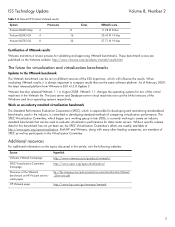
...developing standard methods of comparing virtualization performance. Work on HP ProLiant servers white paper HP VMmark page Hyperlink http://www.vmware.com/products/vmmark/ http://www.spec.org/specvirtualization/ ftp://ftp.compaq.com/pub/products/servers/...benchmark scores are readily available at http://www.spec.org/specvirtualization. ISS Technology Update Table 1-2. The SPEC Virtualization Committee, which will influence the results. Recent HP ProLiant VMmark results System Processors ProLiant DL385 G5p 2 ProLiant DL585 G5 4 ProLiant DL785 G5 8 Cores 8 16 32 Volume 8, Number ...
...developing standard methods of comparing virtualization performance. Work on HP ProLiant servers white paper HP VMmark page Hyperlink http://www.vmware.com/products/vmmark/ http://www.spec.org/specvirtualization/ ftp://ftp.compaq.com/pub/products/servers/...benchmark scores are readily available at http://www.spec.org/specvirtualization. ISS Technology Update Table 1-2. The SPEC Virtualization Committee, which will influence the results. Recent HP ProLiant VMmark results System Processors ProLiant DL385 G5p 2 ProLiant DL585 G5 4 ProLiant DL785 G5 8 Cores 8 16 32 Volume 8, Number ...
Dynamic Power Capping TCO and Best Practices White Paper (EMEA edition)
Page 6
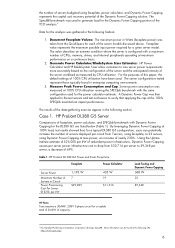
... the Dynamic Power Capping portion of 69%. The results of the server workload as measured by CPU utilization. Case 1. HP ProLiant DL 380 G5 Power and Costs Projections Faceplate Power Calculator Server Power Maximum Number of Servers in Circuit Power Provisioning Cost Per Server @ ...utilization have been used to $9,348 per server to generate load for the analysis was measured at the following URL: http://www.spec.org/. 6 Measure Peak Power Consumption and Cap: Server power consumption was gathered in enterprise computing environments. 3. The server configurations ...
... the Dynamic Power Capping portion of 69%. The results of the server workload as measured by CPU utilization. Case 1. HP ProLiant DL 380 G5 Power and Costs Projections Faceplate Power Calculator Server Power Maximum Number of Servers in Circuit Power Provisioning Cost Per Server @ ...utilization have been used to $9,348 per server to generate load for the analysis was measured at the following URL: http://www.spec.org/. 6 Measure Peak Power Consumption and Cap: Server power consumption was gathered in enterprise computing environments. 3. The server configurations ...
Dynamic Power Capping TCO and Best Practices White Paper (WW edition)
Page 6
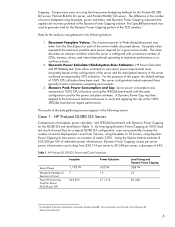
... Performance Evaluation Corporation develops SpecJBB. The difference in enterprise computing environments. 3. The SpecJBB benchmark was used . Case 1. HP ProLiant DL 380 G5 Power and Costs Projections Faceplate Power Calculator Server Power Maximum Number of the server workload as measured by CPU utilization. By...maximum performance on the configuration of the server and the anticipated intensity of Servers in the following URL: http://www.spec.org/. 6 Capping. Measure Peak Power Consumption and Cap: Server power consumption was then applied to the test servers ...
... Performance Evaluation Corporation develops SpecJBB. The difference in enterprise computing environments. 3. The SpecJBB benchmark was used . Case 1. HP ProLiant DL 380 G5 Power and Costs Projections Faceplate Power Calculator Server Power Maximum Number of the server workload as measured by CPU utilization. By...maximum performance on the configuration of the server and the anticipated intensity of Servers in the following URL: http://www.spec.org/. 6 Capping. Measure Peak Power Consumption and Cap: Server power consumption was then applied to the test servers ...


