Casio FX-CG10 Support Question
Casio FX-CG10 Support Question
Find answers below for this question about Casio FX-CG10.Need a Casio FX-CG10 manual? We have 2 online manuals for this item!
Question posted by Anonymous-170713 on February 28th, 2022
Idk Why But The X And Y Lines On My Graph Are Not Showing When I Graph Them
The person who posted this question about this Casio product did not include a detailed explanation. Please use the "Request More Information" button to the right if more details would help you to answer this question.
Current Answers
Answer #1: Posted by SonuKumar on March 1st, 2022 7:09 AM
SonuKumar

Member since:
May 9th, 2021 Points: 16,621,300

Member since:
May 9th, 2021 Points: 16,621,300
https://www.youtube.com/watch?v=jhaBTASKZSE
How do I reset my Casio FX CG10?
Resetting the CASIO PRIZM/fx-CG10 for testing purposes
1. From the Main Menu, highlight the SYSTEM icon and press l or press z. 2. Press y(RESET) to reset the memory.
Please respond to my effort to provide you with the best possible solution by using the "Acceptable Solution" and/or the "Helpful" buttons when the answer has proven to be helpful.
Regards,
Sonu
Your search handyman for all e-support needs!!
Related Casio FX-CG10 Manual Pages
Software User Guide - Page 165
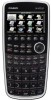
Use d and e to move the cursor to the column you want to copy. The cursor can be black. Store the functions. 4. Generate the table. 6.
line graph 6(GPH-PLT) ... Configure V-Window settings. 3. u To copy a table to a list
Example
To copy the contents of Column x into List 1
K1(LISTMEM)
Input the number of a ...
Software User Guide - Page 166
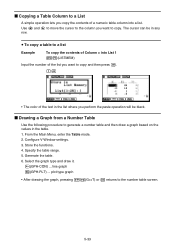
... V-Window settings. On the Setup screen, select "T+G" for "Dual Screen" on the right. 7. Example
Store the two functions below, generate a number table, and then draw a line graph.
Specify the table range. 6. The number table is displayed in the sub-screen on the Setup screen makes it possible to change...
Software User Guide - Page 167

... can make the number table active by pressing K1(CHANGE) or A.
5-35 Example
Store the function Y1 = 3x2 - 2 and simultaneously display its number
table and line graph.
Software User Guide - Page 174
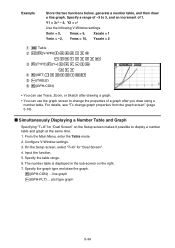
... Note that you need it. Press ccc to specify drawing of data in Dynamic Graph memory for "Dynamic Func Y=" graphic only. 1. This lets you save time, because...Graph 2 !3(V-WIN)1(INITIAL)J 3 !m(SET UP)cc1(On)J 4 5(BUILT-IN)1(SELECT) 5 4(VAR)bwaw 6 2(SET)bwewbwJ 7 3(SPEED)3( )J 8 6(DYNA)
k Graph Calculation DOT Switching Function
Use this function to select "Y=Draw Speed". 3. The Graph...
Software User Guide - Page 176

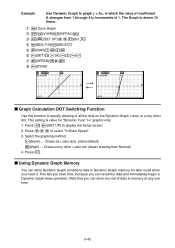
... the sum of a1 = 1, as
expressed by an+2 = an+1 + an, with an initial term of each term to be
included in
value from 1 to draw a line graph. From the Main Menu, enter the Recursion mode. 2. Configure V-Window settings. 3. Specify the recursion formula type and input the formula.
4. Use the table values to...
Software User Guide - Page 196
...
plot}/{pie chart}
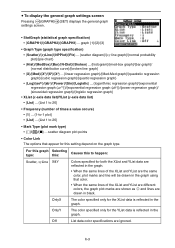
• {Hist}/{MedBox}/{Bar}/{N-Dist}/{Broken} ... {histogram}/{med-box graph}/{bar graph}/ {normal distribution curve}/{broken line graph}
• {X}/{Med}/{X2}/{X3}/{X4} ... {linear regression graph}/{Med-Med graph}/{quadratic regression graph}/{cubic regression graph}/{quartic regression graph}
• {Log}/{aebx}/{abx}/{Power}/{Sin}/{Logistic} ... {logarithmic regression...
Software User Guide - Page 203
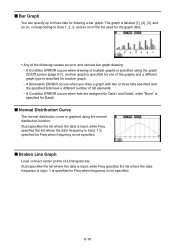
... not specified. A Condition ERROR occurs when drawing of a histogram bar. k Broken Line Graph
Lines connect center points of multiple graphs is specified using the normal distribution function. k Bar Graph
You can specify up to lines 1, 2, 3, and so on of the list used for another graph. - XList specifies the list where the data is input, while Freq specifies...
Software User Guide - Page 207
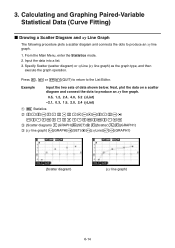
...) or xyLine (xy line graph) as the graph type, and then
execute the graph operation. Press A, J or !J(QUIT) to return to produce an xy line
graph.
1. Input the data into a list.
3.
From the Main Menu, enter the Statistics mode. 2.
Calculating and Graphing Paired-Variable Statistical Data (Curve Fitting)
k Drawing a Scatter Diagram and xy Line Graph
The following procedure plots...
Software User Guide - Page 281

...one of the function menus noted below to perform the corresponding calculation.
• {SL} ... {Calculate depreciation for year j using the straight-line method} • {FP} ... {FP} ....{Calculate depreciation for year j using the fixed-percent method}
{I%} .....{Calculate depreciation ratio}
• {SYD} ... {Calculate depreciation for year j using the sum-of a bond.
Use the following...
Software User Guide - Page 320

...; Paint style settings for each data (ColorNormal, ColorLighter) • Border color settings for each data (one of an xy line graph, replace "Scatter" in the above specification with "xyLine".
• The following is a typical graph condition specification for a med-box graph. S-Gph1 DrawOn, Hist, List 1, List 2, ColorLinkOff, Blue ColorLighter
• The following is a typical...
Software User Guide - Page 367
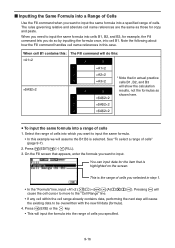
...about how the Fill command handles cell name references in step 1.
• In the "Formula" line, input =A1×2 (!.(=)av(A)b*cw).
See "To select a range of cells. This is ...same formula into which you want to input the same formula. • In this example we will show the calculation
A
B
results, not the formulas as those for example, the Fill command lets you do this ...
Software User Guide - Page 380
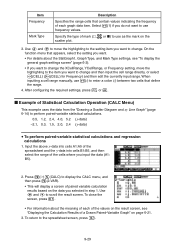
... Frequency
Mark Type
Description
Specifies the range cells that define the range.
4.
Specify the type of Statistical Calculation Operation (CALC Menu)
This example uses the data from the "Drawing a Scatter Diagram and xy Line Graph" (page
6-14) to use frequency values. After configuring the required settings, press J or w. Input the above x-data into...
Software User Guide - Page 390
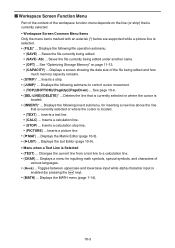
...following submenu to a calculation line. • {CHAR} ... See page 10-6. • {DEL-LINE}/{DELETE}* ... Inserts a calculation line. • {STOP} ... See "Optimizing Storage Memory" on the line (or strip) that ... line is
located. • {INSERT}* ... Toggles between uppercase and lowercase input while alpha character input is Selected • {TEXT} ... Displays a screen showing the...
Software User Guide - Page 396

... produced when called from those in the eActivity mode are complex. k Inserting a Calculation Stop Line
Pressing w after you edit a calculation line on the function menu displays the List Editor.
List memory
will stop line above the currently selected line or strip.
10-9 Inserting a calculation stop line will be
different from those produced when called from the List Editor...
Software User Guide - Page 444
... be dropped automatically, because the fx-9860GII does not support color.
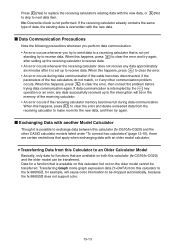
13-13 Transferring Graph mode graph expression data (Y=DATA) from the receiving calculator to clear the error, then ...interrupted by to exchange data between this calculator (fx-CG10/fx-CG20) and the other communication problem occurs. Press 1(Yes) to replace the receiving calculator's existing data with the new data...
Software User Guide - Page 445
... is not sent.
*7 The V-Window dot value is handled when transferring from this calculator (fx-CG10/fx-CG20) but not supported by the receiving calculator are supported by this calculator (fx-CG10/fx-CG20) to its default value. If "Thin" is selected for the fx-CG10/fx-CG20 "Sketch Line" Setup item, for example, the setting will result in incorrect display or a Syntax...
Software User Guide - Page 446
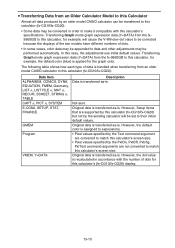
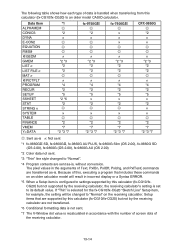
..., Setup items that are not converted to match this calculator's screen size. However, the dot value is . Transferring
Graph mode graph expression data (Y=DATA) from an older model CASIO calculator to this calculator (fx-CG10/fx-CG20). In this case, the adjustments use initial default values. The following table shows how each type of dots.
• In some cases...
Software User Guide - Page 572
...
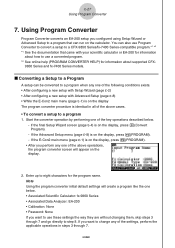
1. Start the converter operation by performing one of the settings, perform the applicable operations in all of the key operations described below . • Associated Scientific Calculator: fx-9860 Series • Associated Data Analyzer: EA-200 • Calibration: None • Password: None If you configured using Setup Wizard or Advanced Setup to step...
Software User Guide - Page 573
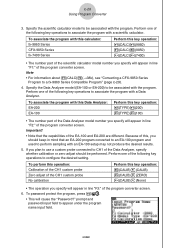
... and used to CH1 of the Data Analyzer, specify whether calibration or zero adjust should keep in line "F1:" of the following key operations to associate the program with this calculator: fx-9860 Series CFX-9850 Series fx-7400 Series
Perform this key operation: 3(CALIB)1(CALIB) 3(CALIB)2(ZERO) 3(CALIB)3(None)
• The operation you...
Software User Guide - Page 583
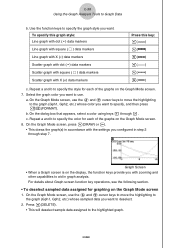
... with the settings you with X (×) data markers
Press this graph style: Line graph with dot ( • ) data markers Line graph with square ( Ⅺ ) data markers Line graph with X (×) data markers Scatter graph with dot ( • ) data markers Scatter graph with square ( Ⅺ ) data markers Scatter graph with zooming and
other capabilities to specify the style for each of...
Similar Questions


How To Adding Two Polar With Algebra Fx 2.0 Graphing Calculator
(Posted by nadershadmehr8 9 years ago)

Casio Graphing Calculator Fx-9750gii How To Put In Degree Mode
(Posted by highgFishf 9 years ago)

Casio Fx-cg10 Graphing Calculator How To Graph An Absolute Value Function
(Posted by ADEzophar 10 years ago)
How To Graph Absolute Value On A Casio Fx Cg10
How do you graph a absolute value question on a casio fx cg10.
How do you graph a absolute value question on a casio fx cg10.
(Posted by Premallstar1996 11 years ago)