
Casio FX-9750GII-SC Support Question
Casio FX-9750GII-SC Support Question
Find answers below for this question about Casio FX-9750GII-SC - Fx-9750gii-ih Graphing Calculator-yellow Sch.Need a Casio FX-9750GII-SC manual? We have 1 online manual for this item!
Question posted by Anonymous-145864 on November 4th, 2014
Determine The Sample Size In Order To Be 96% Confident
...that the sample percentage is in error by no more than 3 percentage points. You have no information and no pre sampling has been performed.
Current Answers
Related Casio FX-9750GII-SC Manual Pages
User Guide - Page 10
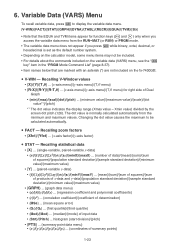
...-variable (standard deviation) and paired-variable (regression) statistical calculations, to perform tests, to analyze data and to perform spreadsheet calculations.
Use this mode when you selected. Use this mode to solve linear equations with two through six unknowns, and high-order equations from 2nd to draw graphs of different solutions as the values assigned to variables...
User Guide - Page 30
... of x-data and y-data}/{population standard deviation}/{sample standard
deviation}/{minimum value}/{maximum value}
• {GRPH} ... {graph data menu}
• {a}/{b}/{c}/{d}/{e} ... {regression coefficient and polynomial coefficients} • {r}/{r2} ... {correlation coefficient}/{coefficient of determination} • {MSe} ... {mean square error} • {Q1}/{Q3} ... {first quartile}/{third...
User Guide - Page 31
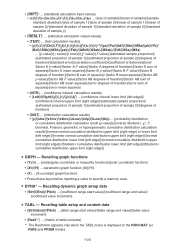
...AB mean squares}/{error degrees of freedom}/{error sum of squares}/{error mean squares}
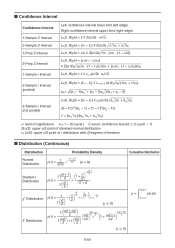
• {INTR} ... {confidence interval calculation results}
• {Left}/{Right}/{ pˆ }/{ pˆ 1}/{ pˆ 2}/{df} ... {confidence interval lower limit (left edge)}/
{confidence interval upper limit (right edge)}/{estimated sample proportion}/ {estimated proportion of sample 1}/{estimated proportion...
User Guide - Page 62
...
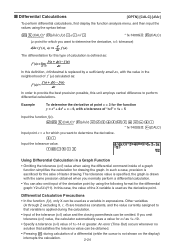
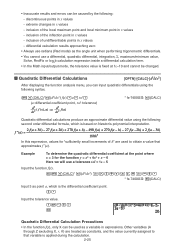
In this unit employs central difference to perform differential calculations. Example
To determine the derivative at point x = 3 for the function y = x3 + 4x2 + x - 6, with the value in a Graph Function
• Omitting the tolerance (tol) value when using the differential command inside of a graph
function simplifies the calculation for drawing the graph. In such a case, precision is used...
User Guide - Page 63
...following :
-
Example
To determine the quadratic differential coefficient at the point where
x = 3 for "sufficiently small increments of undifferentiable points in x values - inclusion of the inflection point in x values - differential calculation results approaching zero • Always use radians (Rad mode) as the angle unit when performing trigonometric differentials. • You...
User Guide - Page 74
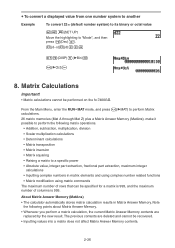
...perform the following points about Matrix Answer Memory. • Whenever you perform a matrix calculation, the current Matrix Answer Memory contents are deleted and cannot be performed on the fx-7400GII. About Matrix Answer Memory (MatAns) • The calculator automatically stores matrix calculation...8226; Scalar multiplication calculations • Determinant calculations • Matrix ...
User Guide - Page 111
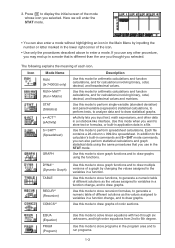
... box to be, and then press U.
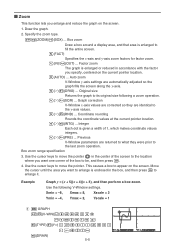
4. Box zoom
Draw a box around a display area, and that area is given a width of 1, which makes coordinate values integers.
(E)(PRE) ... Auto zoom
V-Window y-axis settings are corrected so they were prior to the y-axis values.
(E)(RND) ... Draw the graph.
2. Example
Graph y = (x + 5)(x + 4)(x + 3), and then perform a box zoom.
User Guide - Page 128
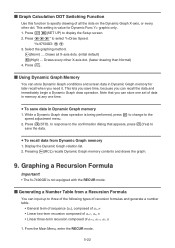
...graphing method. (Norm) ... Press ). I Using Dynamic Graph Memory
You can input up to save data in memory at any one time.
Graphing a Recursion Formula
Important! • The fx-7400Gɉ is being performed... recalls Dynamic Graph memory contents and draws the graph.
9. Press \AAA* to specify drawing of data in Dynamic Graph memory
1.
I Graph Calculation DOT Switching ...
User Guide - Page 161
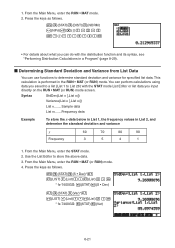
This calculation is performed in List 2, and
determine the standard deviation and variance
x
Frequency
60
70
80
90
3
5
4
1
1. Press the keys as follows.
*(STAT)(S • Dev)*) (LIST)(List)@
(List)AU
* fx-7400GII: (STAT)(S • Dev)
)(STAT)(Var)*) (LIST)(List)@
(List)AU
* fx-7400GII: (STAT)(Var)
6-21
You can perform calculations using data you saved to a ...
User Guide - Page 162

... population standard deviation Ʊ = 1, sample mean M = 1, number of samples n = 2
* "ƫ condition x ƫ0" can use special functions in the RUN • MAT mode or PRGM mode to perform calculations
that need to Execute a Command in a Program" (page 8-32).
5. The Z Test provides a variety of different standardization-based tests. Example
To determine the z score and p-value when a one...
User Guide - Page 175
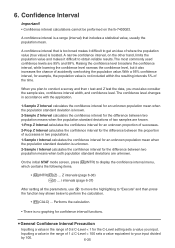
... population mean .
With a 95% confidence interval, for confidence interval functions. Performs the calculation.
• There is no graphing for example, the population value is unknown.
2-Sample t Interval calculates the confidence interval for the C-Level setting sets a value you must also consider
the sample size, confidence interval width, and confidence level. Inputting a value in...
User Guide - Page 178
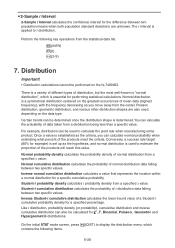
... value of the products will reach this value. S 2-Sample t Interval
2-Sample t Interval calculates the confidence interval for the difference between two population means when both population standard deviations are also used, depending on the data type. The t interval is determined. Distribution
Important! • Distribution calculations cannot be used to t distribution. You can also be...
User Guide - Page 190
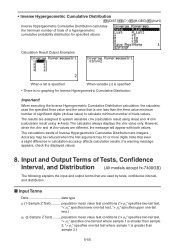
... variable (x) is specified
• There is greater than sample 2, "> ƫ2" specifies one -tail test where sample 1 is smaller than
sample 2.)
6-50
Accuracy may be reduced when the first argument has 10 or more digits.
The calculation results of Tests, Confidence Interval, and Distribution (All models except fx-7400GII)
The following explains the input and output terms...
User Guide - Page 192

... sample M1 mean of sample 1 M2 mean of sample 2
sx sample standard deviation sx1 standard deviation of sample 1 sx2 standard deviation of sample 2 sp pooled sample standard deviation
n size of sample n1 size of sample 1 n2 size of sample 2 df degrees of freedom a constant term b coefficient
se standard error
r correlation coefficient r2 coefficient of determination
Left confidence...
User Guide - Page 194
... significance A = 1 − [C-Level ] C-Level : confidence level (0 C-Level
1)
Z(A/2): upper A/2 point of standard normal distribution tdf (A/2): upper A/2 point of t distribution with df degrees of freedom
I Confidence Interval
Confidence Interval
1-Sample Z Interval 2-Sample Z Interval 1-Prop Z Interval 2-Prop Z Interval 1-Sample t Interval
Left: confidence interval lower limit (left edge...
User Guide - Page 271
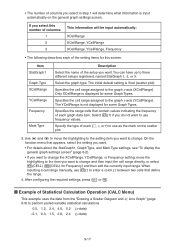
... y-axis (YCellRange).
You can have up to the graph x-axis (XCellRange). Specifies the cell range assigned to perform paired-variable statistical calculations.
0.5, 1.2, 2.4, 4.0, 5.2 (x-data) -2.1, 0.3, 1.5, 2.0, 2.4 (y-data)
9-17 If you select this number of columns:
1 2 3
This information will determine what information is input automatically on the scatter plot.
3. Specifies the...
User Guide - Page 311
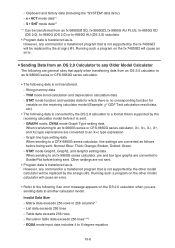
TVM mode bond calculation and depreciation calculation data - GRAPH mode, DYNA mode Graph Type setting data
When transferring to a format that is supported by the fx-7400GII will cause an
error. Running such a program on the receiving calculator model (Example: Ƶ2 GOF Test calculation result data,
etc.) • The following data is converted by the at sign (@). e • ACT...
User Guide - Page 315
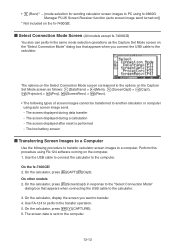
... Mode screen on the Capture Set Mode screen as follows: (DataTrans) = (Mem), (ScreenCapt) = (Capt), (Projector) = (Proj), (ScreenRecv) = (Recv).
• The following procedure to transfer calculator screen images to transfer. 4. Perform this procedure using fx-9860G Manager PLUS Screen Receiver function (auto screen image send turned on)}
* Not included on the computer. 1. On the...
User Guide - Page 323
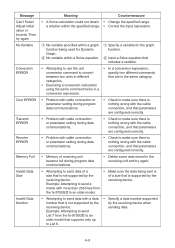
... fx-9750GII to an
older model that supports only up to convert between two units in different categories.
• Executing a conversion calculation using the same command twice in a conversion expression.
• In a conversion expression, specify two different commands that are in the receiving unit and try again No Variable
Conversion ERROR
Com ERROR
Transmit ERROR
Receive ERROR...
User Guide - Page 359
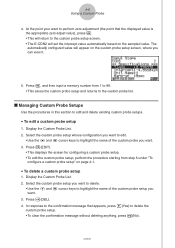
...the custom probe you want to perform zero adjustment (the point that appears, press 1(Yes) to... the custom probe list.
Press 3(EDIT).
• This displays the screen for configuring a custom probe setup. • To edit the custom probe setup, perform...Custom Probe List. 2. Press 4(DEL). 4. At the point your want .
3. k Managing Custom Probe Setups
Use ...
Similar Questions

How To Do Probability On Casio Fx-9750gii
(Posted by pgokmd 9 years ago)

How To Use The Casio Fx-9750gii To Determine 2 Sample T Test
(Posted by barbaRfazi 9 years ago)

Casio Graphing Calculator Fx-9750gii How To Put In Degree Mode
(Posted by highgFishf 9 years ago)


Casio Fx-cg10 Graphing Calculator How To Graph An Absolute Value Function
(Posted by ADEzophar 10 years ago)