
Casio FX-9750GII-SC Support Question
Casio FX-9750GII-SC Support Question
Find answers below for this question about Casio FX-9750GII-SC - Fx-9750gii-ih Graphing Calculator-yellow Sch.Need a Casio FX-9750GII-SC manual? We have 1 online manual for this item!
Question posted by giaacss on June 24th, 2014
How To Find Cubic Regression Equation On Casio Fx9750gii
The person who posted this question about this Casio product did not include a detailed explanation. Please use the "Request More Information" button to the right if more details would help you to answer this question.
Current Answers
Related Casio FX-9750GII-SC Manual Pages
User Guide - Page 10
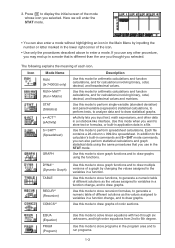
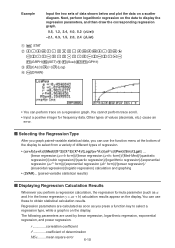
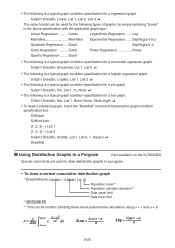
... for arithmetic calculations and function calculations, and for calculations involving binary, octal, decimal, and hexadecimal values and matrices. STAT (Statistics) e • ACT*2 (eActivity) S • SHT*2 (Spreadsheet)
GRAPH
Use this mode to draw statistical graphs. Use this mode to perform single-variable (standard deviation) and paired-variable (regression) statistical calculations, to...
User Guide - Page 104
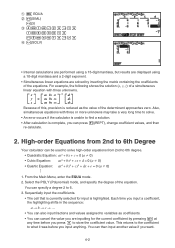
... to what it was before you press U to 6th degree.
• Quadratic Equation: ax2 + bx + c = 0 (a p 0) • Cubic Equation: ax3 + bx2 + cx + d = 0 (a p 0) • Quartic Equation: ax4 + bx3 + cx2 + dx + e = 0 (a p 0)
1. You can press (REPT), change coefficient values, and then re-calculate.
...
2.
Sequentially input the coefficients.
• The cell that is currently selected for...
User Guide - Page 128
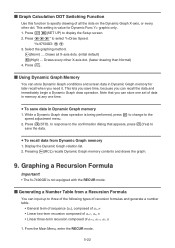
... Main Menu, enter the RECUR mode.
5-22 I Graph Calculation DOT Switching Function
Use this function to select Y=Draw Speed.
*fx-9750Gɉ: AA
3. Press \AAA* to specify drawing of data in Dynamic Graph memory for Dynamic Func Y= graphic only. 1. Press ). Select the graphing method. (Norm) ... While a Dynamic Graph draw operation is not equipped with the RECUR...
User Guide - Page 142
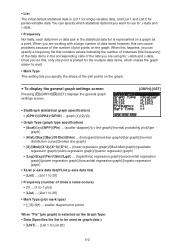
... curve}/{broken line graph} • {X}/{Med}/{X^2}/{X^3}/{X^4} ... {linear regression graph}/{Med-Med graph}/{quadratic
regression graph}/{cubic regression graph}/{quartic regression graph} • {Log}/{Exp}/{Pwr}/{Sin}/{Lgst} ... {logarithmic regression graph}/{exponential regression
graph}/{power regression graph}/{sinusoidal regression graph}/{logistic regression graph}
• XList (x-axis...
User Guide - Page 150
...^x}/{Pwr}/{Sin}/{Lgst} ... {linear regression (ax+b form)}/{linear regression (a+bx form)}/{Med-Med}/{quadratic
regression}/{cubic regression}/{quartic regression}/{logarithmic regression}/{exponential
regression (aebx form)}/{exponential regression (abx form)}/{power regression}/
{sinusoidal regression}/{logistic regression} calculation and graphing
• {2VAR}... {paired-variable statistical...
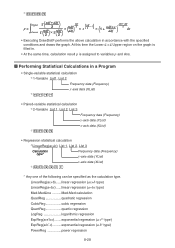
User Guide - Page 152
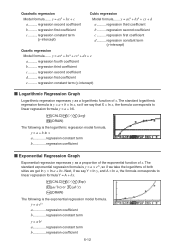
... Regression Graph
Logarithmic regression expresses y as a proportion of the exponential function of x. Quadratic regression
Model formula....... regression constant term (y-intercept)
c .......... regression first coefficient
d.......... regression third coefficient
c .......... regression first coefficient
e .......... y = ax2 + bx + c
Cubic regression
Model formula....... regression...
User Guide - Page 156
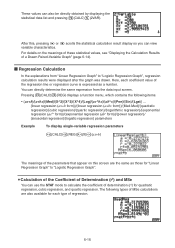
... are the same as a number. These values can use the STAT mode to calculate the coefficient of determination (r2) for quadratic regression, cubic regression, and quartic regression.
S Calculation of the Coefficient of a Drawn Paired-Variable Graph" (page 6-14). The following items.
• {ax+b}/{a+bx}/{Med}/{X^2}/{X^3}/{X^4}/{Log}/{ae^bx}/{ab^x}/{Pwr}/{Sin}/{Lgst} ... {linear...
User Guide - Page 157

... mode also includes a Y-CAL function that uses regression to enter the graph selection mode, and then press U.
The following is the general procedure for a particular x-value after graphing a paired-variable statistical
regression. If there are multiple graphs on the graph.
6-17 After drawing a regression graph, press (G-SLV)(Y-CAL) to calculate the estimated
y-value for using the Y-CAL...
User Guide - Page 158
...DefG feature.
A?(value of xi) *(STAT)*(ţ)U
* fx-7400GII: (STAT) The estimated value ţ is specified for a Med-Med, quadratic regression, cubic regression, quartic regression, sinusoidal regression, or logistic regression graph.
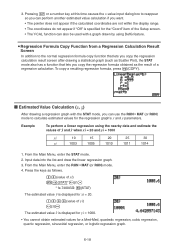
6-18 S Regression Formula Copy Function from a Regression Calculation Result Screen
In addition to calculate estimated values for xi = 20.
@???(value of...
User Guide - Page 237
... ...... Quad
ExpReg(a·bˆx)
Cubic Regression .......... S-Gph1 DrawOn, Logistic, List 1, List 2 =
• The following is a typical graph condition specification for a logistic regression graph. Omitting these items performs the calculation using Ʊ = 1 and ƫ = 0.
p =
1 2
Upper
-
S-Gph1 DrawOn, Sinusoidal, List 1, List 2 =
• The following is a typical...
User Guide - Page 239
... following can be specified as the calculation type. LinearReg(ax+b)......linear regression (ax+b type) LinearReg(a+bx)......linear regression (a+bx type)
Med-MedLine ..........Med-Med calculation QuadReg quadratic regression CubicReg cubic regression QuartReg quartic regression LogReg logarithmic regression
ExpReg(a·eˆbx)........exponential regression (a·ebx type) ExpReg(a·...
User Guide - Page 283
... 10-10 for more information.)
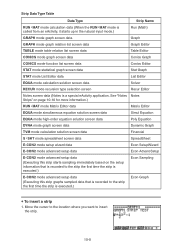
RUN • MAT mode Matrix Editor data EQUA mode simultaneous equation solution screen data EQUA mode high-order equation solution screen data DYNA mode graph screen data
Matrix Editor Simul Equation Poly Equation Dynamic Graph
TVM mode calculation solution screen data S • SHT mode spreadsheet screen data E-CON2 mode setup wizard data...
User Guide - Page 291
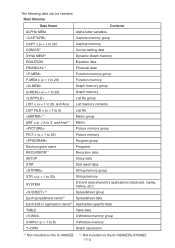
...*1
Conics setting data
DYNA MEM*1
Dynamic Graph memory
EQUATION
Equation data
FINANCIAL*1
Financial data
Function memory group
F-MEM n (n = 1 to 20)
Function memory
Graph memory group
G-MEM n (n = 1 to 20)
Graph memory
List file group
LIST n (n ...V-Window memory
Y=DATA
Graph expression
*1 Not included on the fx-7400GII. *2 Not included on the fx-7400GII/fx-9750GII.
11-3
User Guide - Page 304
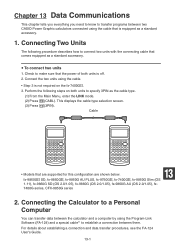
u To connect two units
1. fx-9860GII SD, fx-9860GII, fx-9860G AU PLUS, fx-9750GII, fx-7400GII, fx-9860G Slim (OS
1.11), fx-9860G SD (OS 2.0/1.05), fx-9860G (OS 2.0/1.05), fx-9860G AU (OS 2.0/1.05), fx7400G ...
This chapter tells you everything you need to know to transfer programs between two CASIO Power Graphic calculators connected using the cable that is off. 2.
Check to make sure that are...
User Guide - Page 305
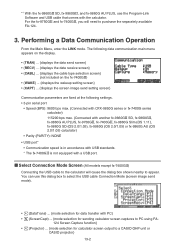
... calculator screen captures to PC using FA-
124 Screen Capture function} • 3(Projector) ... {mode selection for calculator screen output to appear. You can use the Program-Link
Software and USB cable that comes with a USB port.
For the fx-9750GII and fx-7400GII, you will cause the dialog box shown nearby to a CASIO OHP unit or
CASIO...
User Guide - Page 313

...-9850G Series or fx-7400G
Series Calculator
Sender:
fx-9860GII SD, fx-9860GII, fx-9860G AU PLUS
Receiver:
fx-9750GII, fx-7400GII, fx-9860G series, CFX-9850G series, fx-7400G
series
• When the following data is not sent from the OS 2.0 calculator or is sent as a decimal value.
-
Coefficients and calculation results of EQUA mode simultaneous linear equations and high-
u Sending...
User Guide - Page 323
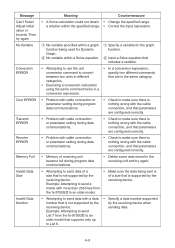
...
Countermeasure
• A Solve calculation could not obtain • Change the specified range.
Example: Attempting to send a
matrix with more than 256 lines from the fx-9750GII to an
older model that supports only up to send data of a
• Make sure the data being used for the graph function.
Input a Solve equation that includes a variable...
User Guide - Page 329
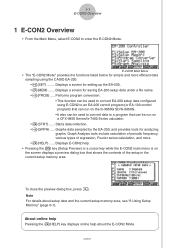
... a program that can be run on the fx-9860G SD/fx-9860G. • It also can run on a CFX-9850 Series/fx-7400 Series calculator. • 4(STRT) ...... Displays E-CON2 ...200 setup data configured using the CASIO EA-200. • 1(SET) ........ Graph Analysis tools include calculation of periodic frequency, various types of regression, Fourier series calculation, and more efficient data sampling...
User Guide - Page 381
..." on page 11-9.
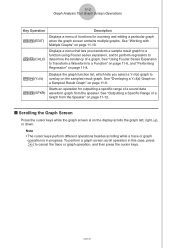
To perform a graph screen scroll operation in progress. K5(Y=fx)
Displays the graph function list, which lets you transform a sample result graph to a function using Fourier series expansion, and to perform regression to overlay on the display scrolls the graph left, right, up, or down. k Scrolling the Graph Screen
Press the cursor keys while...
User Guide - Page 387

..., Quadratic, Cubic, Quartic, Logarithmic, Exponential, Power, Sine, and Logistic. For details about these regression types, see page 6-3-5 through 6-3-10 of the display.
2. On the graph screen, press K, and then 4(CALC). • The [CALC] menu appears at the bottom of the manual that comes with the fx-9860G SD/fx-9860G calculator. 11-8 Graph Analysis Tool Graph Screen Operations...
Similar Questions

How To Graph Cubic Regression On Fx9750gii
(Posted by swikee 10 years ago)

How To Graph Parametric Equations On Fx-9750gii
(Posted by pacodTIMH 10 years ago)


How To Solve Cubic Equation Using Fx-991 Ms Calculator? Pl. Help
(Posted by nvram2001 12 years ago)