Casio FX9750GII Support Question
Casio FX9750GII Support Question
Find answers below for this question about Casio FX9750GII - 0CALCULATOR GRAPHIC.Need a Casio FX9750GII manual? We have 1 online manual for this item!
Question posted by kentobaglo on February 3rd, 2014
Casio Fx-9750gii How To Draw Sin Cos Graph
The person who posted this question about this Casio product did not include a detailed explanation. Please use the "Request More Information" button to the right if more details would help you to answer this question.
Current Answers
Related Casio FX9750GII Manual Pages
User Guide - Page 35

Otherwise, an error occurs.
1-28 interest calculations using {365}*1/{360} days per year setting)
• {365}/{360} ... S List File (list file display settings)
• {FILE} ... {settings of list file on the display}
S Sub Name (list naming)
• {On}/{Off} ... {display on}/{display off}
S Graph Func (function display during graph drawing and trace)
• {On}/{Off...
User Guide - Page 40
...RndFix(Ans,2) 28.570
Ans s I 399.980
* fx-7400GII: (NUM)
I 400.000
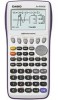
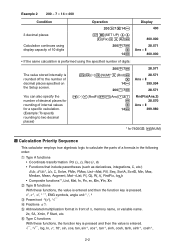
• If the same calculation is performed using the specified number of digits:
The value stored internally..., 3, log, In, ex, 10x, sin, cos, tan, sin-1, cos-1, tan-1, sinh, cosh, tanh, sinh-1, cosh-1,
2-2
Example 2 200 w 7 s 14 = 400
Condition
3 decimal places Calculation continues using display capacity of 10 digits
Operation ...
User Guide - Page 44
...sin, cos, tan, log, In, , and P.
Some of the functions that take up two bytes are
made up of the 26 letters of bytes to variables is 15 digits for the mantissa and 2 digits for each function in the Linear input/output mode and the Math input/output mode. Special Functions
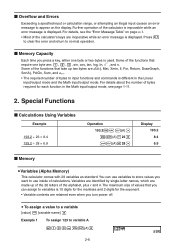
I Calculations...and Errors
Exceeding a specified input or calculation range, or attempting an illegal input ...
User Guide - Page 107
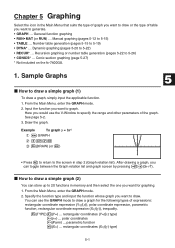
... or number table generation (pages 5-22 to 5-15) • TABLE ... Conic section graphing (page 5-27) * Not included on the fx-7400Gɉ.
1. From the Main Menu, enter the GRAPH mode. 2. Input the function you want to draw.
rectangular coordinates (Y=f(x) type) (r=) ... polar coordinates
(Parm) ... parametric function
(X=) ... rectangular coordinates (X=f(y) type)
5-1
Here...
User Guide - Page 121

... are two methods you can draw by pasting a function, the total number of graphs supported by trace and other ...fx-9750Gɉ: AAA
(V-WIN) DUDUAUA @?U@?UDU)
(TYPE)(Y=)ATV
BT CU (DRAW)
H(PASTE)
• Paste is supported only when "Off" is selected for the x-variable to
generate a number table.
5-15 Using Tables
To enter the TABLE mode, select the TABLE icon on the number of graphs...
User Guide - Page 123

... (r=)
• Parametric (Parm) 1.
You cannot generate a number table for a mixture of variable x
• Edit (delete, insert, and append) rows • Delete a table • Draw a connect type graph • Draw a plot type graph
• {FORM} ... {return to Table relation list} • {DEL} ... {delete table} • {ROW}
• {DEL}/{INS}/{ADD} ... {delete}/{insert}/{add} row •...
User Guide - Page 124

..., enter the TABLE mode. 2. Store the functions. 4. Y1 = 3x2 - 2, Y2 = x2
Use the following procedure to generate a number table and then draw a graph based on the values in any row. I Drawing a Graph from a Number Table
Use the following V-Window settings. S To copy a table to a list
Example
To copy the contents of Column x into List...
User Guide - Page 126
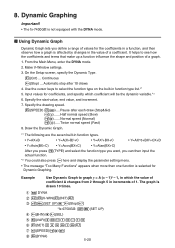
...&Go Half normal speed (Slow Normal speed (Normal) ( )..... Specify the drawing speed. (SPEED) ( ).... Draw the Dynamic Graph.
*1 The following are the seven built-in a function, and then observe how a graph is not equipped with the DYNA mode. Continuous (Stop) ... Dynamic Graphing
Important! • The fx-7400Gɉ is affected by changes in function type list.*1 5. Use...
User Guide - Page 127

... the function type on the Setup screen lets you overlay a graph drawn by changing the coefficient values. 1. Use the cursor keys to graph y = Ax, in function type list. 5. Draw the Dynamic Graph. The Graph is drawn 10 times.
K DYNA (V-WIN)(INIT)) K(SET UP)_ AA*(On))_
*fx-9750Gɉ: A
(B-IN)(SEL) (VAR)@U?U (SET)@UCU@U) (SPEED)( )) (DYNA)
5-21...
User Guide - Page 129

...Specify the table range, and start point and end point for n. Specify the graph type and draw the graph.
(G • CON) ... Use the following V-Window settings. Specify the... recursion between three terms as n changes in
value from a recursion formula, you plan to draw a line graph. I Graphing a Recursion Formula
After generating a number table from 1 to be included in value from 1...
User Guide - Page 131

... you can select use of the two numeric sequences as-is selected "3Display" on the Setup screen and all of them for graphing.
• When "On" is to draw the plot graph, or use the function menu that appears when you press (PHAS) on the table screen.
(an Use numeric sequence for the...
User Guide - Page 132
....
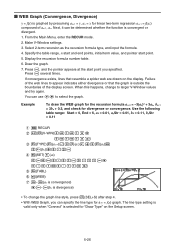
The line type setting is
valid only when "Connect" is divergence)
• To change to select the graph.
Example
To draw the WEB graph for the recursion formula an+1 = -3(an)2 + 3an, bn+1 = 3bn + 0.2, and check for a y = f(x) graph. From the Main Menu, enter the RECUR mode.
2. Use the following table range: Start = 0, End = 6, a0 = 0.01...
User Guide - Page 133
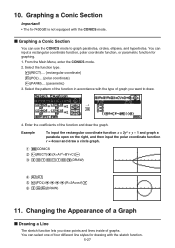
... CONICS mode. 2. Select the pattern of the function in accordance with the type of graph you draw points and lines inside of four different line styles for graphing. 1. You can use the CONICS mode to draw.
1 U
4. Graphing a Conic Section
Important! • The fx-7400Gɉ is not equipped with the sketch function.
5-27 Changing the Appearance...
User Guide - Page 157
... are multiple graphs on the graph.
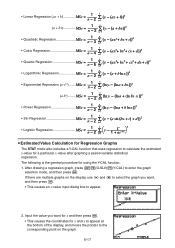
6-17 After drawing a regression graph, press (G-SLV)(Y-CAL) to calculate the estimated
y-value for a particular x-value after graphing a paired-...8226; Sin Regression MSe =
1 n - 2
n i=1
(yi - (a sin (bxi + c) + d ))2
• Logistic Regression MSe =
1 n - 2
n i=1
yi
-
1
C + ae-bxi
2
S Estimated Value Calculation for Regression Graphs
The STAT...
User Guide - Page 158

... RUN • MAT (or RUN)
mode to the normal regression formula copy function that lets you copy the regression calculation result screen after drawing a statistical graph (such as follows.
A?(value of xi) *(STAT)*(ţ)U
* fx-7400GII: (STAT) The estimated value ţ is displayed for xi = 20.
@???(value of yi) (xˆ )U
The estimated value xˆ...
User Guide - Page 196

... turned off for the horizontal axis (frequency).
7-1 Chapter 7 Financial Calculation (TVM)
Important! • The fx-7400Gɉ is turned on, displays the label CASH for the
vertical axis (deposits, withdrawals), and TIME for graphing in the TVM mode:
Axes, Grid, Dual Screen. • Drawing a financial graph while the Label item is not equipped with the...
User Guide - Page 225
...) No parameters
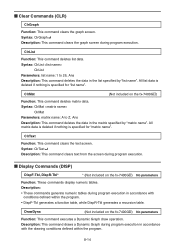
Function: These commands display numeric tables. I Display Commands (DISP)
DispF-Tbl, DispR-Tbl*
* (Not included on the fx-7400GII) No parameters
Function: This command executes a Dynamic Graph draw operation. Syntax: ClrList
ClrList Parameters: list name: 1 to Z, Ans Description: This command deletes the data in the list specified by "matrix name".
All...
User Guide - Page 226

...-Plt produces a plot type graph.
Description:
• This command draws a function graph in accordance with conditions defined within the program.
• DrawFTG-Con produces a connect type graph, while DrawFTG-Plt produces a plot type graph.
DrawGraph
No parameters
Function: This command draws a graph.
Syntax: See "Using Statistical Calculations and Graphs in a generated table to...
User Guide - Page 237
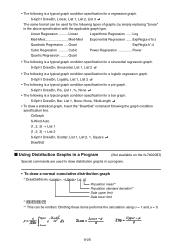
... is a typical graph condition specification for a pie graph. Omitting these items performs the calculation using Ʊ = 1 and ƫ = 0.
p =
1 2
Upper
- Quart
• The following is a typical graph condition specification for the following types of graphs, by simply replacing "Linear" in a program.
• To draw a normal cumulative distribution graph DrawDistNorm...
User Guide - Page 314
... 2. fx-9860GII SD, fx-9860GII, fx-9860G AU PLUS, fx-9750GII, fx-7400GII, fx-9860G Slim
(OS 2.00/1.11), fx-9860G SD (OS 2.00/1.05), fx-9860G (OS 2.00/1.05), fx-9860G AU (OS 2.00/1.05), fx-7400G series... on the fx-7400GII.
3.
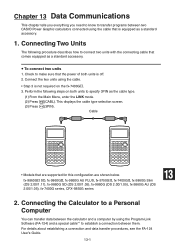
Chapter 13 Data Communications
This chapter tells you everything you need to know to transfer programs between two CASIO Power Graphic calculators connected using ...
Similar Questions

How To Find Tye Value Of Sin Cos Tan On Casio Fx-9750gii
(Posted by mrrwMrTh 9 years ago)


Casio Fx-9750gii - How To Enter Graph Points
(Posted by beDockte 9 years ago)

How To Use Sin,cos,tan And More On The Casio Fx-9750gii
(Posted by paroot74 10 years ago)

On My Casio Fx-9750gii Calculator How To Graph Linear Inequalities
(Posted by ysheimb 10 years ago)