Casio FX9750GII Support Question
Casio FX9750GII Support Question
Find answers below for this question about Casio FX9750GII - 0CALCULATOR GRAPHIC.Need a Casio FX9750GII manual? We have 1 online manual for this item!
Question posted by pcvaruns on January 12th, 2014
How To Calculate Standard Deviation For Probability Distribution Using Casio Fx
9750gii calculator
Current Answers
Related Casio FX9750GII Manual Pages
User Guide - Page 10
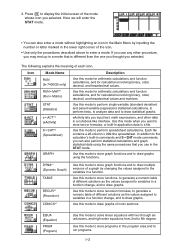
... and to draw statistical graphs. eActivity lets you selected.
Use this mode to perform single-variable (standard deviation) and paired-variable (regression) statistical calculations, to perform tests, to analyze data and to draw graphs using the same procedures that is different than the one you thought you use any other data in a function change , and to...
User Guide - Page 29
...585;)
{menu for paired-variable statistical estimated value, distribution, standard
deviation, variance, and test functions} (all models except fx-7400Gɉ)
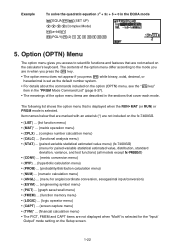
• {CONV} ... {metric conversion menu} • {HYP} ... {hyperbolic calculation menu} • {PROB} ... {probability/distribution calculation menu} • {NUM} ... {numeric calculation menu} • {ANGL} ... {menu for the "Input...
User Guide - Page 31
...DIST} ... {distribution calculation results}
• {p}/{xInv}/{x1Inv}/{x2Inv}/{zLow}/{zUp}/{tLow}/{tUp} ... {probability distribution or cumulative distribution calculation result (p-value)}/{...2}/{standard deviation of sample 1}/{standard deviation of sample 2}/{standard
deviation of sample p} • {RESLT}* ... {statistical calculation output values}
• {TEST} ... {test calculation ...
User Guide - Page 50
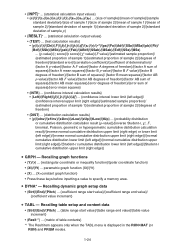
... off the value used for internal calculations to specified digits (0 to 9) (see page 2-2).}
• {GCD} ... {greatest common divisor for two values}
• {LCM} ... {least common multiple for two values}
• {MOD} ... {remainder of the value}
• {Int}/{Frac} ... inverse hyperbolic {sine}/{cosine}/{tangent}
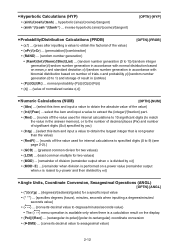
[OPTN]-[HYP]
S Probability/Distribution Calculations (PROB)
[OPTN...
User Guide - Page 55
... a mean body length of 68cm and standard deviation of 8.)
*(E)(PROB)*(RAND)(Norm) 8
68U
RanNorm# (8, 68, 5) (Randomly produces the body lengths of five infants in the above example, and displays them in a list.)
*(E)(PROB)*(RAND)(Norm) 8
68
5U
* fx-7400GII: (PROB)
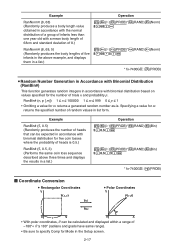
S Random Number Generation in Accordance with Binomial Distribution (RanBin#)
This function generates random integers...
User Guide - Page 146
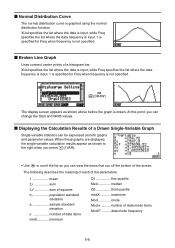
... these graphs are displayed, the single-variable calculation results appear as shown to the right when you press (1VAR).
• Use A to scroll the list so you can change the Start and Width values. x mean 3x sum 3x2 sum of squares
Sx population standard deviation
sx sample standard deviation
n number of data items
minX minimum
Q1...
User Guide - Page 159
... STAT mode. 2. Perform the single-variable statistical calculations.
Standard Normal Distribution
P (t)
Q (t)
R (t)
0t
0t
0t
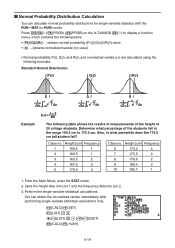
Example
x
The following table shows the results of measurements of the height of the students fall in what percentile does the 175.5 cm tall student fall? I Normal Probability Distribution Calculation
You can obtain the normalized variate immediately...
User Guide - Page 160
...as the STAT mode distribution function calculation (page 6-38). DU
* fx-7400GII: (PROB)
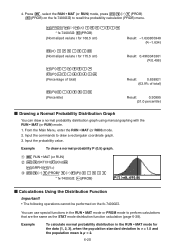
I Drawing a Normal Probability Distribution Graph
You can use special functions in the RUN • MAT mode for 175.5 cm)
(P()? DU * fx-7400GII: (PROB)
(Normalized variate t for 160.5 cm)
(t() @FD DU (Normalized variate t for the data {1, 2, 3}, when the population standard deviation is S = 1.5 and...
User Guide - Page 161
...)AU
* fx-7400GII: (STAT)(Var)
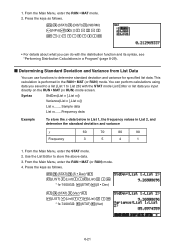
6-21 This calculation is performed in List 2, and
determine the standard deviation and variance
x
Frequency
60
70
80
90
3
5
4
1
1. 1. From the Main Menu, enter the STAT mode. 2. You can do with the STAT mode List Editor or list data you saved to a list (List 1 to List 26) with the distribution function...
User Guide - Page 162
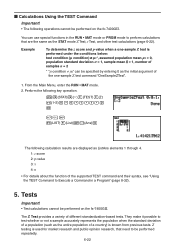
...under the conditions below:
test condition (ƫcondition) x ƫ0*, assumed population mean ƫ0 = 0, population standard deviation Ʊ = 1, sample mean M = 1, number of samples n = 2
* "ƫ condition x ƫ0" can use special functions in the RUN • MAT mode or PRGM mode to perform calculations
that need to be specified by entering 0 as the entire population of different...
User Guide - Page 163
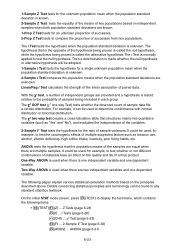
... compares the population means when the population standard deviations are
unknown. The
hypothesis that the population means of samples being proved is tested relative to determine conformance with normal distribution or binomial distribution. The C2 GOF test (C2 one dependent variable.
One-Way ANOVA is used to the probability of the samples are equal when there...
User Guide - Page 164
... only for drawing the graph. Calculation Result Output Example
Mx11.4 .......... direction of a two-tail test.
Displays z score.
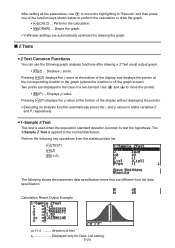
S 1-Sample Z Test
This test is used when the population standard deviation is applied to test the hypothesis. The
1-Sample Z Test is known to the normal distribution. I Z Tests
S Z Test Common Functions
You can use A to move the highlighting to...
User Guide - Page 165
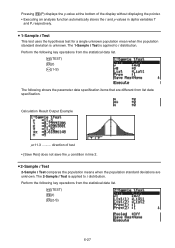
... shows the parameter data specification items that are known to the normal distribution.
• [Save Res] does not save the M1 condition in line 2.
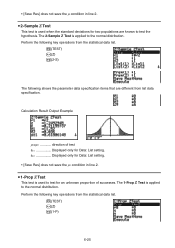
S 1-Prop Z Test
This test is applied
to test the
hypothesis. The 1-Prop Z Test is used when the standard deviations for Data: List setting.
• [Save Res] does not save the...
User Guide - Page 167
...
6-27 The 1-Sample t Test is unknown.
S 1-Sample t Test
This test uses the hypothesis test for a single unknown population mean when the population
standard deviation is applied to t distribution. Calculation Result Output Example
Mx11.3 .......... The 2-Sample t Test is applied to t distribution.
direction of the display without displaying the pointer. • Executing an...
User Guide - Page 175
...the data, you input.
t intervals (page 6-37)
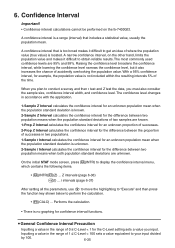
After setting all the parameters, use A to move the highlighting to "Execute" and then press the function key shown ...interval, on the fx-7400GII.
6. A confidence interval that includes a statistical value, usually the population mean when
the population standard deviation is unknown.
2-Sample t Interval calculates the confidence interval for...
User Guide - Page 178
... estimating what percent of normal distribution data falling between two specific values. Normal cumulative distribution calculates the probability of the products meet the criteria.
S 2-Sample t Interval
2-Sample t Interval calculates the confidence interval for the difference between two population means when both population standard deviations are also used, depending on the data type...
User Guide - Page 190

... Distribution calculation, the calculator uses the specified Area value and the value that even a slight difference in calculation accuracy affects calculation results. • Inverse Hypergeometric Cumulative Distribution (DIST)(E)(H.GEO)(InvH)
Inverse Hypergeometric Cumulative Distribution calculates the minimum number of trials of a hypergeometric cumulative probability distribution...
User Guide - Page 192

...standard deviation (Ʊ > 0) ƫ (Distribution mean
Lower (Distribution lower boundary Upper (Distribution upper boundary
df (Distribution degrees of freedom (df > 0) n:df (Distribution numerator degrees of freedom (positive integer) d:df (Distribution denominator degrees of freedom (positive integer)
Numtrial (Distribution) ........number of trials
p (Distribution success probability...
User Guide - Page 237
...(a·eˆbx)
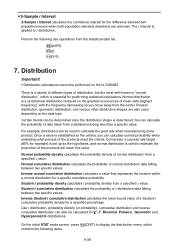
Quadratic Regression .... Omitting these items performs the calculation using Ʊ = 1 and ƫ = 0.
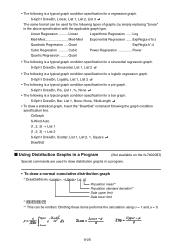
p =...normal cumulative distribution graph DrawDistNorm , [,S, ƫ]
Population mean*1 Population standard deviation*1 Data ... DrawStat
I Using Distribution Graphs in a Program
(Not available on the fx-7400GII)
Special commands are used to draw distribution graphs in...
User Guide - Page 314
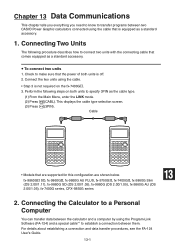
... two CASIO Power Graphic calculators connected using the cable.
• Step 3 is not required on both units is equipped as a standard accessory. For details about establishing a connection and data transfer procedures, see the FA-124 User's Guide.
13-1 S To connect two units
1. fx-9860GII SD, fx-9860GII, fx-9860G AU PLUS, fx-9750GII, fx-7400GII, fx-9860G Slim
(OS 2.00/1.11), fx-9860G...
Similar Questions

How To Use Standard Deviation Function With Casio Fx-991es
(Posted by Sagmagi 9 years ago)

How To Calculate Standard Deviation Using Casio Fx-9750gii
(Posted by Jebcc214 9 years ago)


Tutorial On How To Use Fx-9750gii
(Posted by persetti 10 years ago)

How To Calculate Standard Deviation On Casio Fx-9750gii
(Posted by generst 10 years ago)