

HP 50g_user's manual_English_HDPSG49AEM8.pdf
Page 3
... organized by subject in order of difficulty: from elementary mathematics to real and complex number calculations, operations with lists, vectors, and matrices, graphics, calculus applications, vector analysis, differential equations, probability and statistics. This manual contains examples that will become a faithful companion for producing complex figures in very little time. For symbolic operations...
... organized by subject in order of difficulty: from elementary mathematics to real and complex number calculations, operations with lists, vectors, and matrices, graphics, calculus applications, vector analysis, differential equations, probability and statistics. This manual contains examples that will become a faithful companion for producing complex figures in very little time. For symbolic operations...
HP 50g_user's manual_English_HDPSG49AEM8.pdf
Page 11
Reference, 15-4 Chapter 16 - Statistical Applications Entering data, 16-1 Calculating single-variable statistics, 16-2 Sample vs. Equation Library Reference, 19-4 Limited Warranty, W-1 Service, W-3 Regulatory information, W-5 Disposal of Waste Equipment by reformatting), 18-4 ... 17-2 Reference, 17-2 Chapter 18 - population, 16-2 Obtaining frequency distributions, 16-3 Fitting data to a function y = f(x), 16-5 Obtaining additional summary statistics, 16-6 Confidence intervals, 16-7 Hypothesis testing, 16-9 Reference, 16-11 Chapter 17 - Numbers in the European Union, W-7 Page TOC-8
Reference, 15-4 Chapter 16 - Statistical Applications Entering data, 16-1 Calculating single-variable statistics, 16-2 Sample vs. Equation Library Reference, 19-4 Limited Warranty, W-1 Service, W-3 Regulatory information, W-5 Disposal of Waste Equipment by reformatting), 18-4 ... 17-2 Reference, 17-2 Chapter 18 - population, 16-2 Obtaining frequency distributions, 16-3 Fitting data to a function y = f(x), 16-5 Obtaining additional summary statistics, 16-6 Confidence intervals, 16-7 Hypothesis testing, 16-9 Reference, 16-11 Chapter 17 - Numbers in the European Union, W-7 Page TOC-8
HP 50g_user's manual_English_HDPSG49AEM8.pdf
Page 154
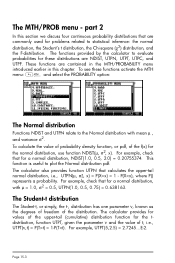
...we discuss four continuous probability distributions that are NDIST, UTPN, UTPT, UTPC, and UTPF. part 2 In this chapter. The calculator also provides function UTPN that for these functions activate the MTH menu: „´ and select the PROBABILITY option: The ...Normal distribution Functions NDIST and UTPN relate to statistical inference: the normal distribution, the Student's t distribution, the Chi-square (χ2) distribution, and the F-distribution. The functions provided by the calculator to plot the Normal distribution pdf. To see these distributions ...
...we discuss four continuous probability distributions that are NDIST, UTPN, UTPT, UTPC, and UTPF. part 2 In this chapter. The calculator also provides function UTPN that for these functions activate the MTH menu: „´ and select the PROBABILITY option: The ...Normal distribution Functions NDIST and UTPN relate to statistical inference: the normal distribution, the Student's t distribution, the Chi-square (χ2) distribution, and the F-distribution. The functions provided by the calculator to plot the Normal distribution pdf. To see these distributions ...
HP 50g_user's manual_English_HDPSG49AEM8.pdf
Page 156
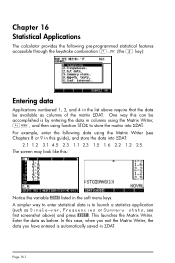
... this can be available as columns of the matrix ΣDAT. Page 16-1 Chapter 16 Statistical Applications The calculator provides the following data using function STOΣ to launch a statistics application (such as before. In this : Notice the variable @£DAT listed in the soft...data you have entered is by entering the data in the list above ) and press #EDIT#. For example, enter the following pre-programmed statistical features accessible through the keystroke combination ,Ù (the 5 key): Entering data Applications numbered 1, 2, and 4 in columns using the Matrix ...
... this can be available as columns of the matrix ΣDAT. Page 16-1 Chapter 16 Statistical Applications The calculator provides the following data using function STOΣ to launch a statistics application (such as before. In this : Notice the variable @£DAT listed in the soft...data you have entered is by entering the data in the list above ) and press #EDIT#. For example, enter the following pre-programmed statistical features accessible through the keystroke combination ,Ù (the 5 key): Entering data Applications numbered 1, 2, and 4 in columns using the Matrix ...
HP 50g_user's manual_English_HDPSG49AEM8.pdf
Page 157
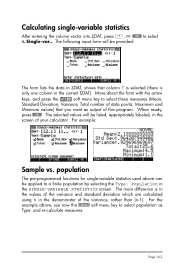
... form lists the data in ΣDAT, shows that you want as Type: and re-calculate measures: Page 16-2 The main difference is only one column in the SINGLE-VARIABLE STATISTICS screen. When ready, press @@@OK@@. Calculating single-variable statistics After entering the column vector into ΣDAT, press ,Ù @@@OK@@ to select those...
... form lists the data in ΣDAT, shows that you want as Type: and re-calculate measures: Page 16-2 The main difference is only one column in the SINGLE-VARIABLE STATISTICS screen. When ready, press @@@OK@@. Calculating single-variable statistics After entering the column vector into ΣDAT, press ,Ù @@@OK@@ to select those...
HP 50g_user's manual_English_HDPSG49AEM8.pdf
Page 161
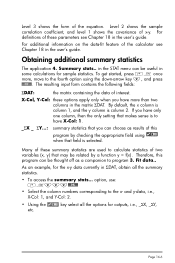
...As an example, for the x-y data currently in the matrix ΣDAT. option, use OK@@@ • Select the column numbers corresponding to calculate statistics of these options apply only when you can be useful in the user's guide. To get started, press ,Ù once more than two columns... in ΣDAT, obtain all the options for sample statistics. By default, the x column is column 1, and the y column is selected. Fit data.. Level 3 shows the form of x-y. Many of two ...
...As an example, for the x-y data currently in the matrix ΣDAT. option, use OK@@@ • Select the column numbers corresponding to calculate statistics of these options apply only when you can be useful in the user's guide. To get started, press ,Ù once more than two columns... in ΣDAT, obtain all the options for sample statistics. By default, the x column is column 1, and the y column is selected. Fit data.. Level 3 shows the form of x-y. Many of two ...
HP 50g_user's manual_English_HDPSG49AEM8.pdf
Page 164
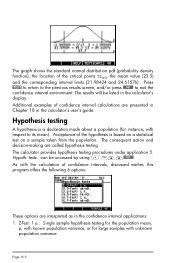
..., discussed earlier, this program offers the following 6 options: These options are called hypothesis testing. Hypoth. can be listed in the calculator's display. Press @TEXT to return to the previous results screen, and/or press @@@OK@@@ to its mean). tests.. As with...61576). The results will be accessed by using ,Ù--@@@OK@@@. Hypothesis testing A hypothesis is based on a statistical test on a sample taken from the population. The graph shows the standard normal distribution pdf (probability density function), the location of the hypothesis is a declaration made about...
..., discussed earlier, this program offers the following 6 options: These options are called hypothesis testing. Hypoth. can be listed in the calculator's display. Press @TEXT to return to the previous results screen, and/or press @@@OK@@@ to its mean). tests.. As with...61576). The results will be accessed by using ,Ù--@@@OK@@@. Hypothesis testing A hypothesis is based on a statistical test on a sample taken from the population. The graph shows the standard normal distribution pdf (probability density function), the location of the hypothesis is a declaration made about...

HP 50g_user's manual_English_HDPSG49AEM8.pdf
Page 166
The P-value is z0 = 5.656854. The critical values of ±zα/2 = ±1.959964, corresponding to critical ⎯x range of concepts, and advanced statistical applications, are available in Chapter 18 in the user's guide. This information can be observed graphically by pressing the soft-menu key @GRAPH: Reference Additional materials on statistical analysis, including definitions of {147.2 152.8}. The test z value is 1.54×10⁻⁸. Then, we reject H0: µ = 150, against H1: µ ≠ 150. Page 16-11
The P-value is z0 = 5.656854. The critical values of ±zα/2 = ±1.959964, corresponding to critical ⎯x range of concepts, and advanced statistical applications, are available in Chapter 18 in the user's guide. This information can be observed graphically by pressing the soft-menu key @GRAPH: Reference Additional materials on statistical analysis, including definitions of {147.2 152.8}. The test z value is 1.54×10⁻⁸. Then, we reject H0: µ = 150, against H1: µ ≠ 150. Page 16-11