
HP 50g_user's manual_English_HDPSG49AEM8.pdf
Page 76
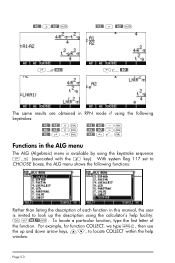
...; @@A1@@ , ¹µ @@A1@@ @@A2@@ -µ @@A1@@ @@A2@@ /µ @@A2@@ „ ¸µ Functions in this manual, the user is available by using the calculator's help window. For example, for function COLLECT, we type ~c, then use the up the description using the keystroke sequence ,× (associated with the 4 key). With system flag...
...; @@A1@@ , ¹µ @@A1@@ @@A2@@ -µ @@A1@@ @@A2@@ /µ @@A2@@ „ ¸µ Functions in this manual, the user is available by using the calculator's help window. For example, for function COLLECT, we type ~c, then use the up the description using the keystroke sequence ,× (associated with the 4 key). With system flag...
HP 50g_user's manual_English_HDPSG49AEM8.pdf
Page 126
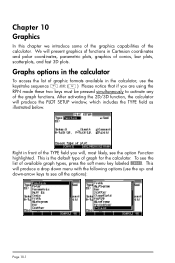
... keys must be pressed simultaneously to see all the options): Page 10-1 This will , most likely, see the list of graph for the calculator. Right in the calculator, use the up- and down menu with the following options (use the keystroke sequence „ô(D) Please notice that if...a drop down -arrow keys to activate any of the calculator. To see the option Function highlighted. This is the default type of available graph types, press the soft menu key labeled @CHOOS. We will produce the PLOT SETUP window, which includes the TYPE field as illustrated below. Chapter ...
... keys must be pressed simultaneously to see all the options): Page 10-1 This will , most likely, see the list of graph for the calculator. Right in the calculator, use the up- and down menu with the following options (use the keystroke sequence „ô(D) Please notice that if...a drop down -arrow keys to activate any of the calculator. To see the option Function highlighted. This is the default type of available graph types, press the soft menu key labeled @CHOOS. We will produce the PLOT SETUP window, which includes the TYPE field as illustrated below. Chapter ...
HP 50g_user's manual_English_HDPSG49AEM8.pdf
Page 127
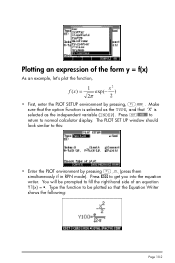
The PLOT SET UP window should look similar to fill the right-hand side of the form y = f(x) As an example, let's plot the function, f (x) = 1 exp(− x2 ) 2π 2 • First, ... return to get you into the equation writer. You will be plotted so that 'X' is selected as the independent variable (INDEP). Press @ADD to normal calculator display. Make sure that the option Function is selected as the TYPE, and that the Equation Writer shows the following: Page 10-2 Type the function...
The PLOT SET UP window should look similar to fill the right-hand side of the form y = f(x) As an example, let's plot the function, f (x) = 1 exp(− x2 ) 2π 2 • First, ... return to get you into the equation writer. You will be plotted so that 'X' is selected as the independent variable (INDEP). Press @ADD to normal calculator display. Make sure that the option Function is selected as the TYPE, and that the Equation Writer shows the following: Page 10-2 Type the function...
HP 50g_user's manual_English_HDPSG49AEM8.pdf
Page 128
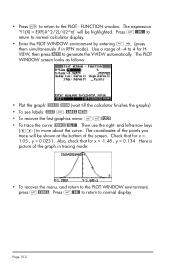
... if in tracing mode: • To recover the menu, and return to generate the V-VIEW automatically. The PLOT WINDOW screen looks as follows: • Plot the graph: @ERASE @DRAW (wait till the calculator finishes the graphs) • To see labels: @EDIT L @LABEL @MENU • To recover the first graphics menu: LL@)PICT • To...
... if in tracing mode: • To recover the menu, and return to generate the V-VIEW automatically. The PLOT WINDOW screen looks as follows: • Plot the graph: @ERASE @DRAW (wait till the calculator finishes the graphs) • To see labels: @EDIT L @LABEL @MENU • To recover the first graphics menu: LL@)PICT • To...

HP 50g_user's manual_English_HDPSG49AEM8.pdf
Page 130
• With the option In highlighted, press @@@OK@@@. Simply, what the calculator does is increased to 0.25. • To recover the original x-increment of 0.5 you can use the option zoom out by pressing @ZOOM ˜@@@OK@@@. • ... the Indep: and 'Y' as the Depnd: variables. • Press L@@@OK@@@ to return to normal calculator display. • Press „ò, simultaneously if in RPN mode, to access to the PLOT SETUP window. • Change TYPE to access the PLOT WINDOW screen. For example, if you want to visualize z = f(x,y) = x2+y2, we can do...
• With the option In highlighted, press @@@OK@@@. Simply, what the calculator does is increased to 0.25. • To recover the original x-increment of 0.5 you can use the option zoom out by pressing @ZOOM ˜@@@OK@@@. • ... the Indep: and 'Y' as the Depnd: variables. • Press L@@@OK@@@ to return to normal calculator display. • Press „ò, simultaneously if in RPN mode, to access to the PLOT SETUP window. • Change TYPE to access the PLOT WINDOW screen. For example, if you want to visualize z = f(x,y) = x2+y2, we can do...

HP 50g_user's manual_English_HDPSG49AEM8.pdf
Page 131
• Keep the default plot window ranges to read : Step Indep: 20 Depnd: 16 • Press @ERASE @DRAW to see the surface plot. By using the arrow keys (š™-˜) you can change accordingly. Sample views: Page 10-6 The result is to produce the graph, although, the times utilized for the ... changing the surface orientation on your own. For the time being we'll keep the default values of the graph: • When done, press @EXIT. • Press @CANCL to return to the PLOT WINDOW environment. • Change the Step data to be used in the plot. The larger these number, the ...
• Keep the default plot window ranges to read : Step Indep: 20 Depnd: 16 • Press @ERASE @DRAW to see the surface plot. By using the arrow keys (š™-˜) you can change accordingly. Sample views: Page 10-6 The result is to produce the graph, although, the times utilized for the ... changing the surface orientation on your own. For the time being we'll keep the default values of the graph: • When done, press @EXIT. • Press @CANCL to return to the PLOT WINDOW environment. • Change the Step data to be used in the plot. The larger these number, the ...

HP 50g_user's manual_English_HDPSG49AEM8.pdf
Page 132
...the EDIT environment. • Press @CANCL to return to normal calculator display. • When done, press @EXIT. • Press @CANCL to return to PLOT WINDOW. • Press $, or L@@@OK@@@, to return to the PLOT WINDOW environment. Reference Additional information on graphics is available in Chapters 12 ...and 22 in RPN mode, to access the PLOT SETUP window. • Press ˜ and type 'SIN(X^2+Y^2)' @@@OK@@@. • Press @ERASE @DRAW to normal calculator display. Page 10-7 Then, press $, or L@@@OK@@@, to return to draw the slope field plot...
...the EDIT environment. • Press @CANCL to return to normal calculator display. • When done, press @EXIT. • Press @CANCL to return to PLOT WINDOW. • Press $, or L@@@OK@@@, to return to the PLOT WINDOW environment. Reference Additional information on graphics is available in Chapters 12 ...and 22 in RPN mode, to access the PLOT SETUP window. • Press ˜ and type 'SIN(X^2+Y^2)' @@@OK@@@. • Press @ERASE @DRAW to normal calculator display. Page 10-7 Then, press $, or L@@@OK@@@, to return to draw the slope field plot...