User Guide
Page 114
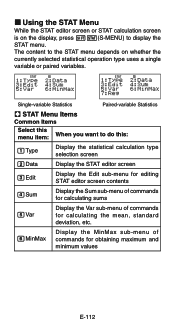
...) to do this: 1Type Display the statistical calculation type selection screen 2Data Display the STAT editor screen 3Edit Display the Edit sub-menu for editing STAT editor screen contents 4Sum Display the Sum sub-menu of commands for calculating sums 5Var Display the Var sub-menu of commands for calculating the mean, standard deviation, etc. 6MinMax Display the MinMax sub-menu...
...) to do this: 1Type Display the statistical calculation type selection screen 2Data Display the STAT editor screen 3Edit Display the Edit sub-menu for editing STAT editor screen contents 4Sum Display the Sum sub-menu of commands for calculating sums 5Var Display the Var sub-menu of commands for calculating the mean, standard deviation, etc. 6MinMax Display the MinMax sub-menu...
User Guide
Page 115
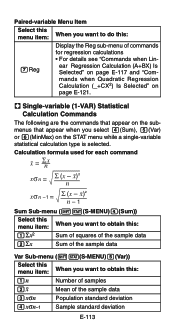
...)) Select this menu item: When you want to obtain this : 7Reg Display the Reg sub-menu of the sample data 3xσn Population standard deviation 4xσn-1 Sample standard deviation E-113 ear Regression Calculation (A+BX) Is Selected" on page E-117 and "Commands when Quadratic Regression Calculation (_+CX2) Is Selected" on the STAT menu while a single-variable statistical...
...)) Select this menu item: When you want to obtain this : 7Reg Display the Reg sub-menu of the sample data 3xσn Population standard deviation 4xσn-1 Sample standard deviation E-113 ear Regression Calculation (A+BX) Is Selected" on page E-117 and "Commands when Quadratic Regression Calculation (_+CX2) Is Selected" on the STAT menu while a single-variable statistical...
User Guide
Page 118
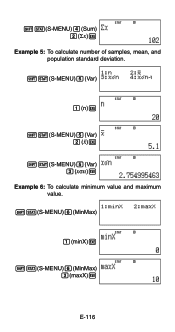
STAT 17(S-MENU)4(Sum) 2(Σx)E Example 5: To calculate number of samples, mean, and population standard deviation. 17(S-MENU)5(Var) STAT 1(n)E STAT 17(S-MENU)5(Var) 2(o)E STAT 17(S-MENU)5(Var) 3(xσn)E Example 6: To calculate minimum value and maximum value. 17(S-MENU)6(MinMax) STAT 1(minX)E STAT 17(S-MENU)6(MinMax) 2(maxX)E E-116
STAT 17(S-MENU)4(Sum) 2(Σx)E Example 5: To calculate number of samples, mean, and population standard deviation. 17(S-MENU)5(Var) STAT 1(n)E STAT 17(S-MENU)5(Var) 2(o)E STAT 17(S-MENU)5(Var) 3(xσn)E Example 6: To calculate minimum value and maximum value. 17(S-MENU)6(MinMax) STAT 1(minX)E STAT 17(S-MENU)6(MinMax) 2(maxX)E E-116

User Guide
Page 120
... obtain this: 1n Number of samples 2o Mean of the X-data 3xσn Population standard deviation of the X-data 4xσn-1 Sample standard deviation of the X-data 5p Mean of the Y-data 6yσn Population standard deviation of the Y-data 7yσn-1 Sample standard deviation of the Y-data MinMax Sub-menu (17(S-MENU)6(MinMax)) Select this menu item...
... obtain this: 1n Number of samples 2o Mean of the X-data 3xσn Population standard deviation of the X-data 4xσn-1 Sample standard deviation of the X-data 5p Mean of the Y-data 6yσn Population standard deviation of the Y-data 7yσn-1 Sample standard deviation of the Y-data MinMax Sub-menu (17(S-MENU)6(MinMax)) Select this menu item...
User Guide
Page 125
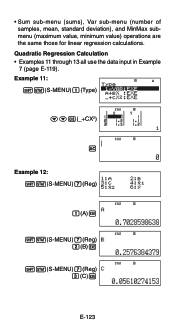
Quadratic Regression Calculation • Examples 11 through 13 all use the data input in Example 7 (page E-119). • Sum sub-menu (sums), Var sub-menu (number of samples, mean, standard deviation), and MinMax submenu (maximum value, minimum value) operations are the same those for linear regression calculations. Example 11: 17(S-MENU)1(Type) STAT ccE(_+CX2) STAT A Example 12: 17(S-MENU)7(Reg) STAT 1(A)E STAT 17(S-MENU)7(Reg) 2(B)E STAT 17(S-MENU)7(Reg) 3(C)E E-123
Quadratic Regression Calculation • Examples 11 through 13 all use the data input in Example 7 (page E-119). • Sum sub-menu (sums), Var sub-menu (number of samples, mean, standard deviation), and MinMax submenu (maximum value, minimum value) operations are the same those for linear regression calculations. Example 11: 17(S-MENU)1(Type) STAT ccE(_+CX2) STAT A Example 12: 17(S-MENU)7(Reg) STAT 1(A)E STAT 17(S-MENU)7(Reg) 2(B)E STAT 17(S-MENU)7(Reg) 3(C)E E-123


