User Guide
Page 2
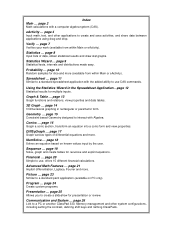
... or another ClassPad 330. page 17 Graph various types of data, obtain statistical results and draw stat graphs. Program ... Verify ... page 10 Random samples for presentation or review. Using the Statistics Wizard in rectangular or parametric form. Conics ... Sequence ... Financial ... page 24 Create custom programs. Presentation ... page 26 Link to interact with Algebra. page 2 Math calculations with...
... or another ClassPad 330. page 17 Graph various types of data, obtain statistical results and draw stat graphs. Program ... Verify ... page 10 Random samples for presentation or review. Using the Statistics Wizard in rectangular or parametric form. Conics ... Sequence ... Financial ... page 24 Create custom programs. Presentation ... page 26 Link to interact with Algebra. page 2 Math calculations with...
User Guide
Page 10
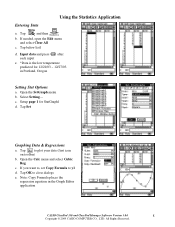
.../03 - 12/27/03 in the Graph Editor application CASIO ClassPad 330 and ClassPad Manager Software Version 3.04 8 Copyright © 2009 CASIO COMPUTER CO., LTD. Tap y to y1 d. Note: Copy Formula places the regression equation in Portland, Oregon Setting Stat Options a. Select Setting... All Rights Reserved. c. Tap OK to close dialogs e. Using the Statistics Application Entering Data a.
.../03 - 12/27/03 in the Graph Editor application CASIO ClassPad 330 and ClassPad Manager Software Version 3.04 8 Copyright © 2009 CASIO COMPUTER CO., LTD. Tap y to y1 d. Note: Copy Formula places the regression equation in Portland, Oregon Setting Stat Options a. Select Setting... All Rights Reserved. c. Tap OK to close dialogs e. Using the Statistics Application Entering Data a.
User Guide
Page 11
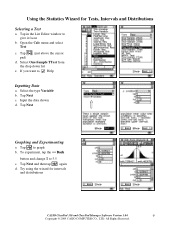
Open the Calc menu and select Test c. Tap r (just above the cursor pad) d. To experiment, tap the Tap Next Graphing and Experimenting a. If you want to give it focus b. Tap Next c. Using the Statistics Wizard for Tests, Intervals and Distributions Selecting a Test a. Select One-Sample TTest from the drop down list e. Input the data shown d. Tap in the List Editor window to , s Help Inputting Data a. Select the type Variable b. Tap $ to graph b.
Open the Calc menu and select Test c. Tap r (just above the cursor pad) d. To experiment, tap the Tap Next Graphing and Experimenting a. If you want to give it focus b. Tap Next c. Using the Statistics Wizard for Tests, Intervals and Distributions Selecting a Test a. Select One-Sample TTest from the drop down list e. Input the data shown d. Tap in the List Editor window to , s Help Inputting Data a. Select the type Variable b. Tap $ to graph b.
User Guide
Page 14
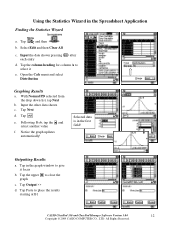
...graph updates automatically! All Rights Reserved. Tap m and then b. With Normal PD selected from the drop down list, tap Next b. Tap Next d. Selected data is in the Spreadsheet Application Finding the Statistics Wizard a. Tap the column heading for column A to place the results starting at B1 CASIO ClassPad 330 and ClassPad... Manager Software Version 3.04 12 Copyright © 2009 CASIO COMPUTER CO., LTD. ...
...graph updates automatically! All Rights Reserved. Tap m and then b. With Normal PD selected from the drop down list, tap Next b. Tap Next d. Selected data is in the Spreadsheet Application Finding the Statistics Wizard a. Tap the column heading for column A to place the results starting at B1 CASIO ClassPad 330 and ClassPad... Manager Software Version 3.04 12 Copyright © 2009 CASIO COMPUTER CO., LTD. ...

